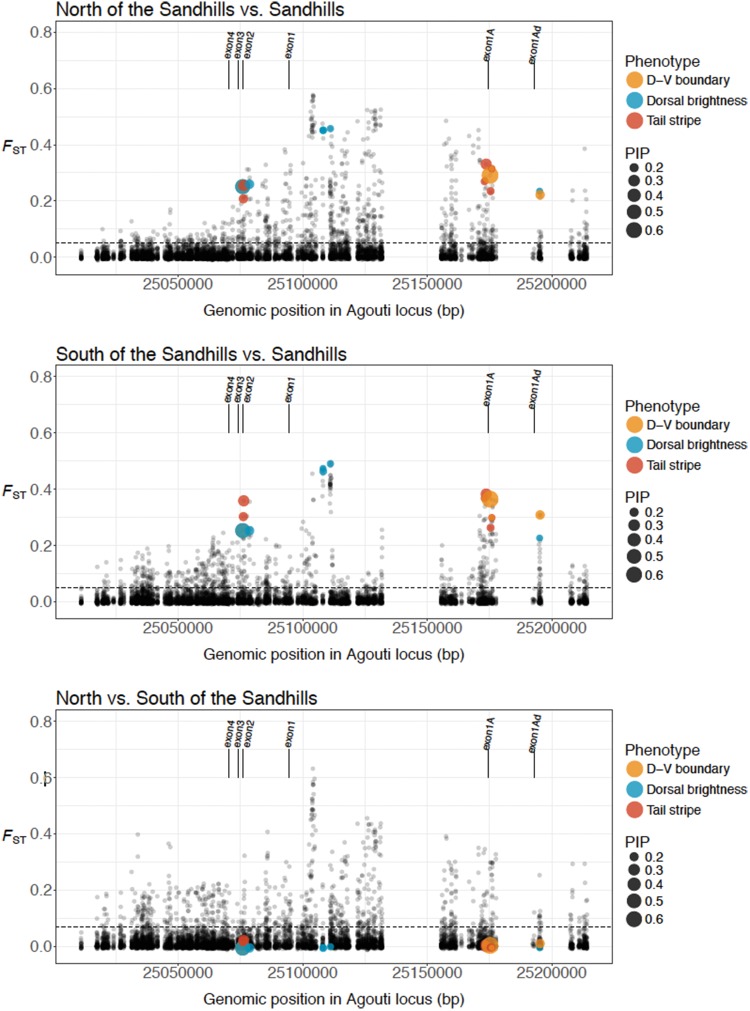
Fig. 5.
Genetic differentiation across the Agouti locus. Genetic differentiation observed between populations on the Sand Hills and populations north of the Sand Hills (top panel), populations on the Sand Hills and populations south of the Sand Hills (middle panel), and populations north and south of the Sand Hills. Dotted lines indicate the genome-wide average FST between these comparisons. As shown, differentiation is generally greatly elevated across the region, with a number of highly differentiated SNPs particularly when comparing on versus off Sand Hills populations, which correspond to SNPs associated with different aspects of the cryptic phenotype (PIP scores are indicated by the size of the dots as shown in the legend, and significant SNPs are labeled with respect to the associated phenotype). Populations to the north and south of the Sand Hills are also highly differentiated in this region, likely owing to differing levels of gene flow with the Sand Hills populations, yet the SNPs underlying the cryptic phenotype are not differentiated between these dark populations.

