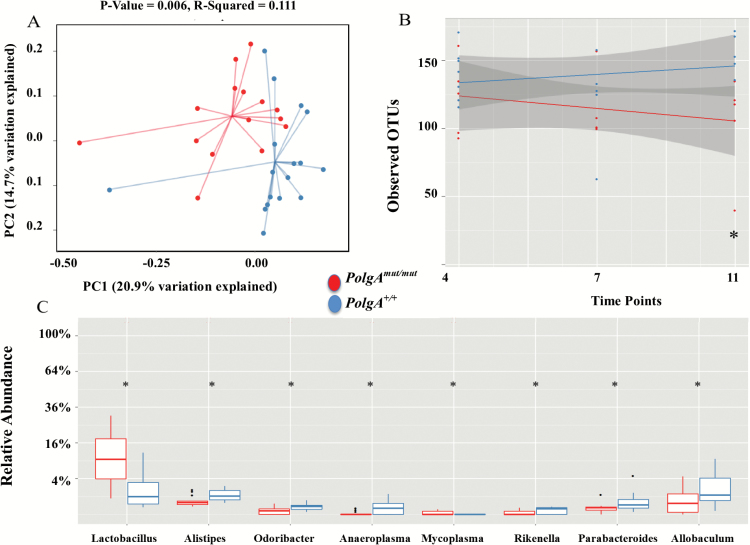
Figure 5.
Microbiome for sedentary PolgAmut/mut (n = 15) and PolgA+/+ mice (PolgA+/+n = 21). (A) Principle co-ordinate analysis (PCoA) of unweighted UniFrac analysis. (B) Regression analysis showing number of observed OTU difference at 4, 7, and 11 months between sedentary PolgA+/+ and PolgAmut/mut mice. Grey shading indicates the 95% confidence interval of the mean. (C) Boxplots showing the relative abundance of bacteria at genus level at 11 months. * denotes a significant difference between PolgAmut/mut and PolgA+/+ mice using Kruskal–Wallis, p ≤ .05.

