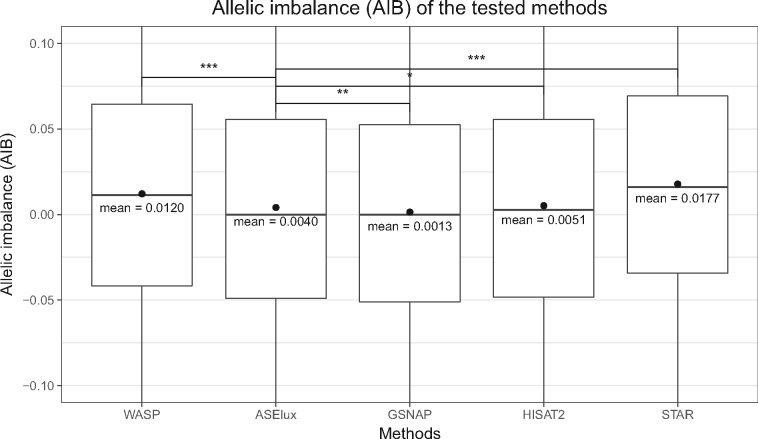
Fig. 4.
For ASE analysis, ASElux has less reference bias than WASP, and the general aligners, STAR and HISAT, when testing the 20 real RNA-seq samples. * indicates a P-value of 1.05 × 10⁻³ (two-sided); ** indicates a P-value of 7.44 × 10⁻¹⁴ (two-sided); and *** indicates a P-value <2.2 × 10⁻¹⁶ (two-sided). Y axis displays the allele frequency differences between the tested methods and 0.5 (i.e. the two alleles are expressed equally). The reference bias of ASElux is significantly smaller than that of HISAT2, STAR and WASP, but higher than GSNAP. Y axis was limited from -0.1 to 0.1 to show the distribution of most SNPs. The red dots indicate the mean values of each method

