
Extended Data Figure 1. Effect of maintaining the naïve state on DNA methylation in ESCs.
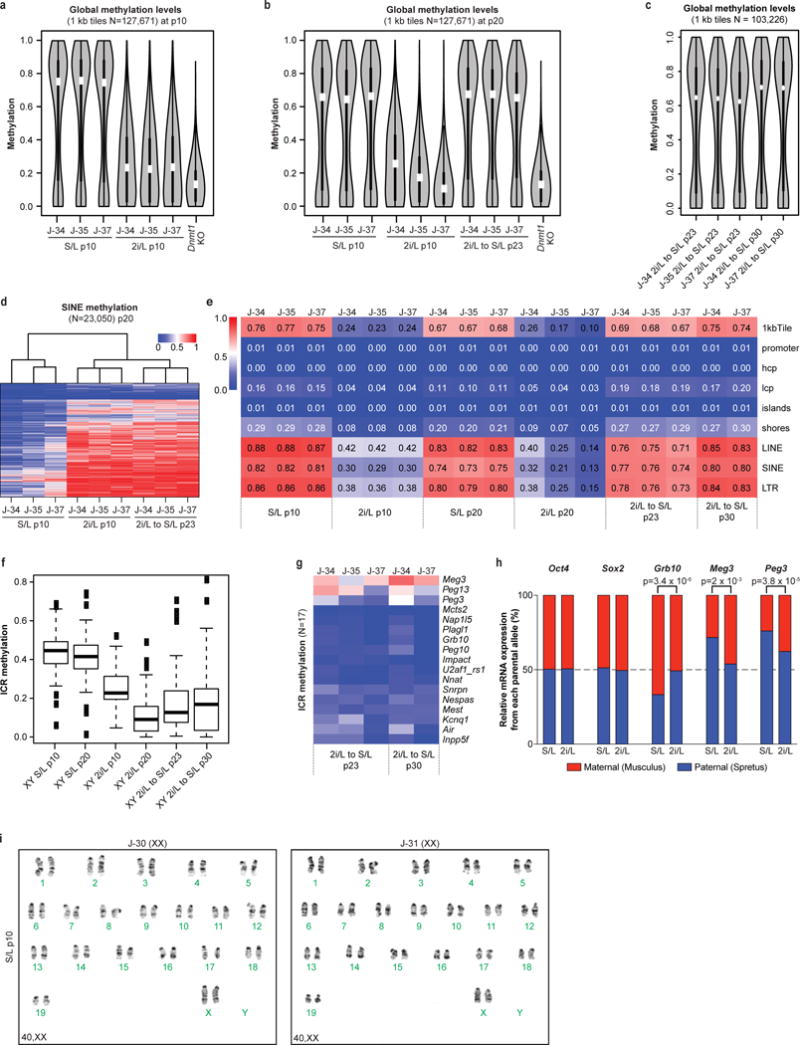
(a–c) Violin plots showing global methylation levels of ESCs at p10 (a), p20 (b) and after being placed back into S/L at p23 and 30 (c) by reduced representation bisulfite sequencing (RRBS). Hypomethylated Dnmt1 knock-out (KO) ESCs were included as control. White dots, median value.
(d) Heatmap of DNA methylation levels at SINE elements in ESCs.
(e) Median methylation levels of different genomic elements in the indicated conditions.
(f) Box plot showing methylation levels of ICRs cultured in each condition.
(g) ICR methylation levels after being re-exposed to S/L for the indicated passages.
(h) RNA sequencing was performed on a F1 Mus musculus × Mus spretus stem cell line cultured in 2i/L for 6 passages. Normalized read counts of mRNA transcripts expressed from the paternal or maternal alleles are shown based on multiple allele-discriminating SNPs for each gene (6 or more SNPs per gene). Statistical analysis (two-tail t-tests) for allelic biases of the SNPs is shown.
(i) Karyotyping results from two female ESC lines cultured in S/L for 10 passages.