
Figure 4. Mek1/2 suppression underlies the epigenetic and chromosomal changes observed in ESCs.
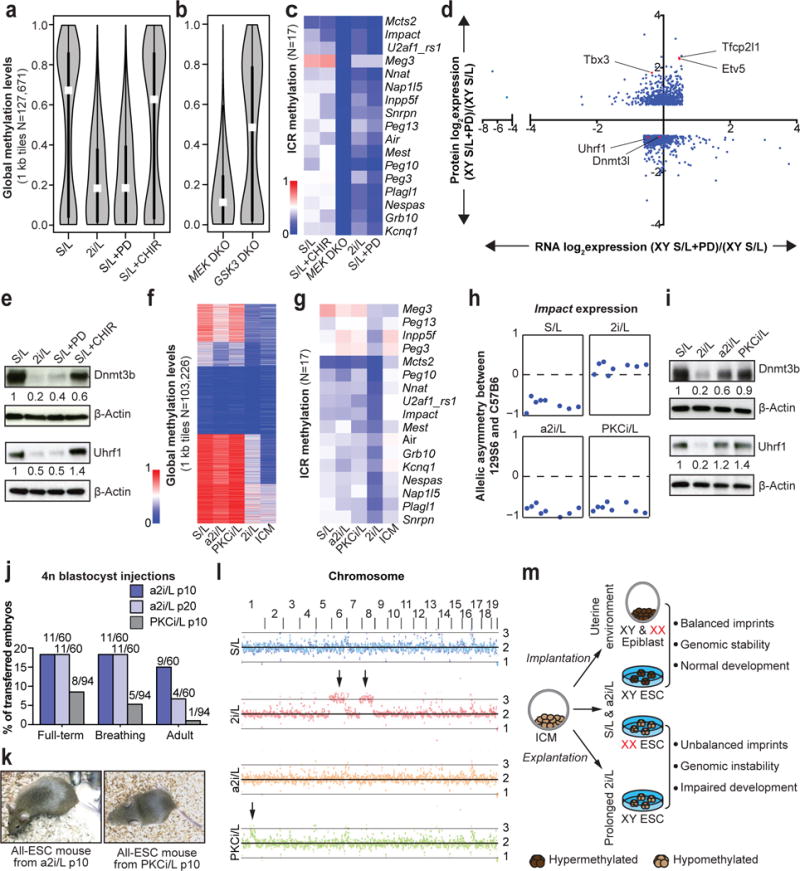
(A) Global methylation levels of male ESC cultured in indicated conditions (n=3 biological replicates). White dots, median value.
(B) Global methylation levels of Mek1/2 double knock-out (DKO) iPSCs and GSk3α/β DKO ESCs cultured in S/L. White dots, median value.
(C) ICR methylation levels in male pluripotent stem cells with the indicated pharmacological or genetic perturbations.
(D) Differential protein levels between S/L and S/L+PD (>1.5-fold) are plotted along the y-axis and the corresponding differentially expressed RNAs are plotted along the x-axis.
(E) Western blot analysis of Dnmt3b and Uhrf1 in the labeled consitions.
(F–G) Global (F) and ICR (G) methylation levels in male ESCs cultured in indicated conditions. ICM, inner cell mass.
(H) Allelic expression of the imprinted gene Impact.
(I) Western blot analysis of Dnmt3b and Uhrf1 in the labeled conditions.
(J) 4n blastocyst injections. Numbers of animals obtained per total number of transferred embryos are shown. Details in Supplementary Table 2.
(K) Adult all-ESC mice generated using a2i/L-cultured (left) or PKCi/L-cultured (right) male ESCs.
(L) Chromosomal copy number analysis by whole genome sequencing. Black arrows indicate trisomies 6 and 8 in 2i/L-cultured ESC lines and the partial amplification of chromosome 1 in PKCi/L-cultured ESC lines, respectively.
(M) Graphical summary of results.