
Extended Data Figure 2. Effects of prolonged 2i/L culture on H2A.X deposition in ESCs.
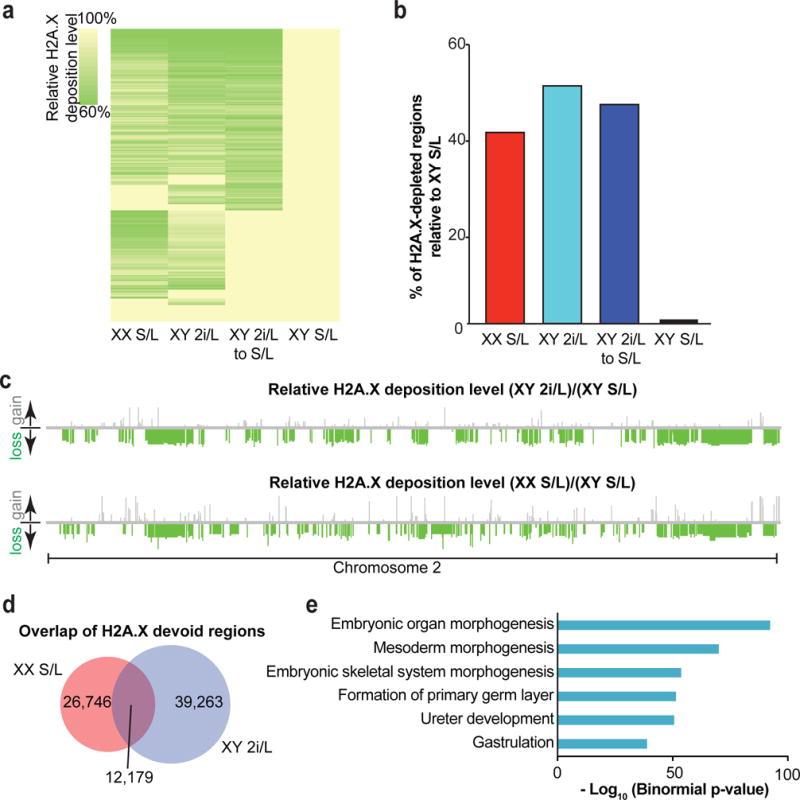
(a) Heatmap showing global H2A.X deposition loss relative to male ESCs cultured in S/L. Three ESC lines per condition (male S/L, male 2i/L, female S/L) at passage 10 and two ESC lines (male 2i/L to S/L) at passage 30 were analyzed (see Fig. 1a).
(b) Bar graph quantifying the percentage of H2A.X depleted regions relative to male ESCs cultured in S/L. Each bar represents median values of biological replicates of samples in (a).
(c) Relative H2A.X deposition on a representative chromosome. Relative losses (green bars) or gains (gray bars) of H2A.X are mapped to their location on chromosome 2.
(d) Overlap of devoid H2A.X regions common to both female ESCs cultured in S/L and male cells cultured in 2i/L.
(e) H2A.X devoid regions present in the overlap identified in (d) were significantly enriched for genes involved in the listed developmental pathways. The GREAT bioinformatic database was used to bin the genes identified into transcriptional networks.