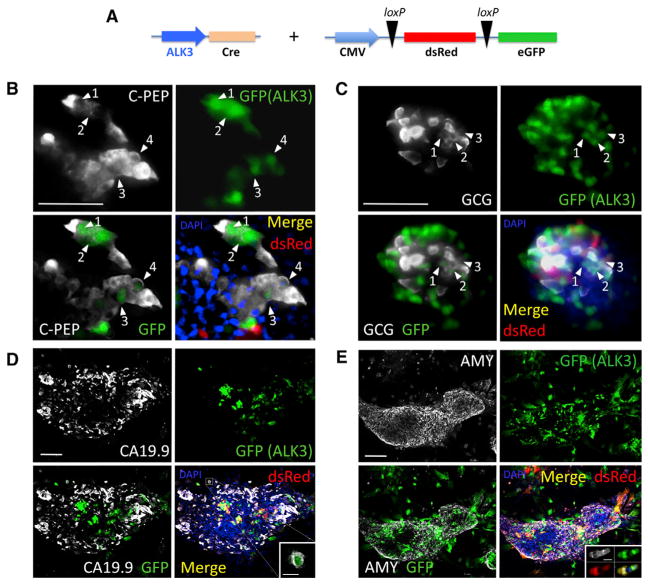
Figure 1. Lineage-Tracing Studies.
(A) Experimental design. The ALK3 promoter was used to drive Cre expression. The reporter expresses dsRed (red) or EGFP (green) upon Cre-mediated loxP excision. Both constructs were simultaneously transduced into hNEPT cells. Upon BMP-7 treatment, we set out to determine whether EGFP was present in cells expressing C-peptide (C-PEP), glucagon (GCG), CA19.9, or amylase (AMY). These markers are shown in white in (B) through (E), respectively. EGFP (green) and dsRed (red) + channel merge (DAPI, blue) are shown for all experiments. Each panel also shows an EGFP (green) + mature marker (white) merge to facilitate the identification of cells that co-express both markers. Confocal microscopy was used in the acquisition of all these images.
(B) ALK3-Cre + reporter + C-peptide IF. Abundant C-peptide+ cells expressed EGFP (white arrows), suggesting a significant participation of ALK3+ cells in BMP-7-induced C-peptide+ cells.
(C) ALK3-Cre + reporter + GCG IF. As previously observed for C-PEP, a significant percentage of EGFP-tagged cells were also GCG+ (white arrows).
(D) ALK3-Cre + reporter + CA19.9 IF. In contrast with C-PEP and GCG, very few CA19.9 cells expressed the EGFP tag. A representative microphotograph shows co-localization in only one cell of a large cluster (magnified in the inset).
(E) ALK3-Cre + reporter + amylase IF. As with CA19.9, less than 1% of amylase-expressing cells were EGFP-tagged (representative microphotograph showing no co-localization). Inset: example of a rare small cluster of Amy+/EGFP+ cells elsewhere. Numbered white arrows denote incidences of co-localization between the indicated marker and GFP.

