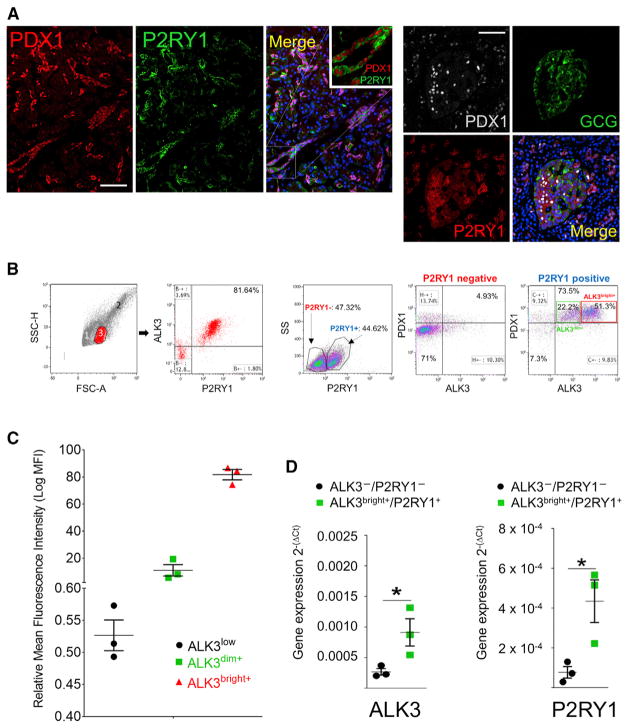
Figure 3. P2RY1 Is a Surrogate Surface Marker for PDX1.
Expression of the P2RY1 surface marker was predicted by bioinformatics to co-localize with that of PDX1 in human pancreatic samples.
(A) Left: from left to right, PDX1 (red), P2RY1 (green), and merged (DAPI, blue). A magnified detail is shown in the inset. Scale bar: 50 μm. Right: P2RY1 stains both PDX1+ ducts and islet β cells, but not α cells. From top left, clockwise: PDX1 (gray), glucagon (green), P2RY1 (red), and merged channels. Scale bar: 50 μm.
(B) ALK3/P2RY1 FACS analysis of hNEPT. A forward/side scatter of hNEPT shows three distinct subpopulations identified in a forward/side scatter (1–3). Population no. 3 corresponds to ~21% of the total population and is 81% enriched in ALK3+/ P2RY1+ cells. P2RY1 sorting alone results in a significant enrichment (>73%) in cells that are both ALK3+ and PDX1+. Insets in the last panel show the percentage of cells with ALK3bright+ (51.3%, red) and ALK3dim+ (22.2%, green) phenotypes.
(C) Mean fluorescence intensity (MFI) of the two populations (ALK3dim+ and ALK3bright+) detected by FACS analysis of hNEPT preparations. A third fraction (ALK3low) is usually considered negative, owing to its very low detection threshold. MFI of each fraction is shown in the y axis (error bars indicate SE).
(D) ALK3bright+/P2RY1+ cells are enriched in their corresponding mRNAs after sorting when compared to the ALK3−/P2RY1− fraction, as determined by qRT-PCR. Gene expression (y axis) is measured as 2−(ΔCt). *p < 0.05.
In (A): n = 4 biological replicates; in (B)–(C): n = 3 biological replicates; in (D): n = 3 biological replicates. Confocal microscopy was used in the acquisition of all these images.

