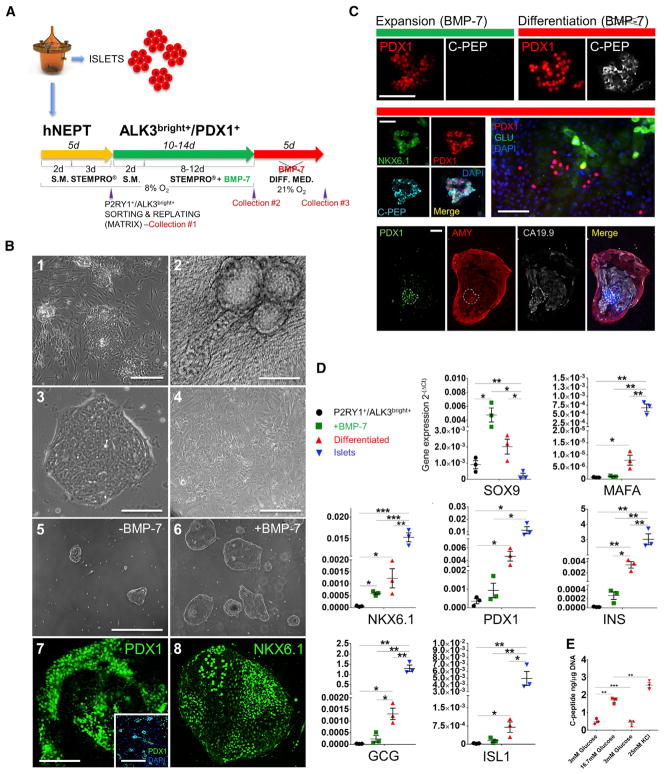
Figure 4. Culture, Expansion and Differentiation of P2RY1+/ALK3bright+ Cells.
(A) hNEPT are obtained as the by-product of islet isolation. After 5 days in culture in low-oxygen conditions (48 hr in starting medium, S.M., and 72 hr in STEMPRO), P2RY1/ALK3 (bright fraction) live-cell sorting is performed on the attached cells (collection point 1). Sorted cells are then re-plated in low oxygen (48 hr in S.M. and then STEMPRO for the remainder of this stage) and cultured with BMP-7 for 10–14 days, a period during which colonies form and expand. Collection point 2 is at the end of this stage. In a third phase, BMP-7 is removed, and cells are cultured in differentiation medium for an additional 5 days at 21% oxygen. Collection point 3 is at the end of this stage.
(B) P2RY1+/ALK3bright+ cells grow both atop (1) and embedded in (2) fibroblast feeder layers. In the latter case, three-dimensional ductal-like structures are often observed. Using a 1:1 collagen I/fibronectin matrix and low-oxygen concentration, P2RY1+/ALK3bright+ cells form colonies of small cells with well-defined edges (3). In contrast, the negative fraction (P2RY1−/ALK3− cells) grows as a mesenchymal-like monolayer (4). In the absence of BMP-7, colonies from P2RY1+/ ALK3bright cells form but grow slowly (5). BMP-7 administration, however, induces sustained colony growth. Panels 5 and 6 show cultures of P2RY1+/ALK3bright+ cell-derived colonies without or with BMP-7, respectively, at the same time point (day 10 after sorting). Regardless of whether BMP-7 is supplemented, P2RY1+/ ALK3bright cell-derived colonies exhibit an IF signal for PDX1 (7) and NKX6.1 (8). Shown in the pictures are BMP-7-treated colonies at day 10 after sorting. Inset in (7) shows PDX1 staining (green) and DAPI (blue) IF of P2RY1+/ALK3bright cell-derived colonies at day 2 after sorting. Scale bars: 100 μM for 1, 5, 6, and 7-inset; and 50 μM for 2, 3, 4, 7, and 8.
(C) During the expansion (top left, green bar), colonies exhibit PDX1 (red) but not C-peptide (white) IF signal. In contrast, after BMP-7 withdrawal and differentiation (top right, red bar), C-peptide signal is detected in many PDX1+ structures. The middle left panel shows a representative C-peptide+ colony with nuclear PDX1 and NKX6.1 signal. The middle right panel shows glucagon+ cells, and the bottom panel the different channels of a colony displaying ductal (CA19.9 signal, light gray) and acinar (amylase, red) cells with a PDX1+ core that remains largely undifferentiated (white dotted lines). Scale bars: 50 μm.
(D) qRT-PCR of representative pancreatic endocrine markers at sorting (black data points), at the end of the BMP-7-mediated expansion phase (green data points) and following differentiation (red data points). y axis: 2−(ΔCt) values against 18S. Error bars indicate SD. *p < 0.05; **p < 0.01; ***p < 0.005.
(E) Glucose-stimulated C-peptide release of differentiated cells (n = 3 preparations) at 3 mM (first low), 16.7 mM (high), 3 mM (second low), and 25 mM KCl-induced depolarization. y axis: nanograms of C-peptide/micrograms of DNA. Error bars indicate SE. *p < 0.05; **p < 0.01; ***p < 0.005.
In (B): n = 5 biological replicates; in (C): n = 4 biological replicates; in (D) and (E): n = 3 biological replicates. In (B): 1–6, brightfield microscopy was used; in 7 and 8, confocal microscopy was used. In (C), standard fluorescence microscopy was used.

