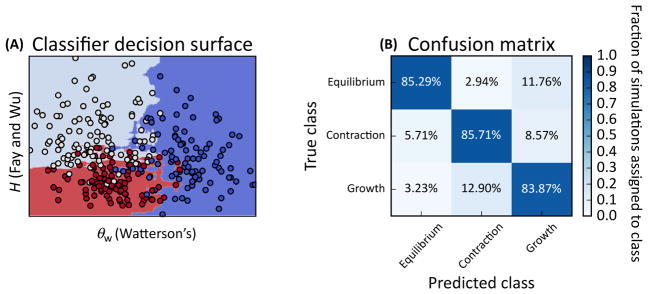
Figure II. An Example Application of Supervised ML to Demographic Model Selection.
In this example population samples experiencing constant population size (equilibrium), a recent instantaneous population decline (contraction), or recent instantaneous expansion (growth) were simulated. A variant of a random forest classifier [51] was trained, which is an ensemble of semi-randomly generated decision trees, to discriminate between these three models on the basis of a feature vector consisting of two population genetic summary statistics [34,74]. (A) The decision surface: red points represent the growth scenario, dark-blue points represent equilibrium, and light-blue points represent contraction. The shaded areas in the background show how additional datapoints would be classified – note the non-linear decision surface separating these three classes. (B) The confusion matrix obtained from measuring classification accuracy on an independent test set. Data were simulated using ms [75], and classification was performed via scikitlearn [76]. All code used to create these figures can be found in a collection of Jupyter notebooks that demonstrate some simple examples of using supervised ML for population genetic inference provided here: https://github.com/kern-lab/popGenMachineLearningExamples.

