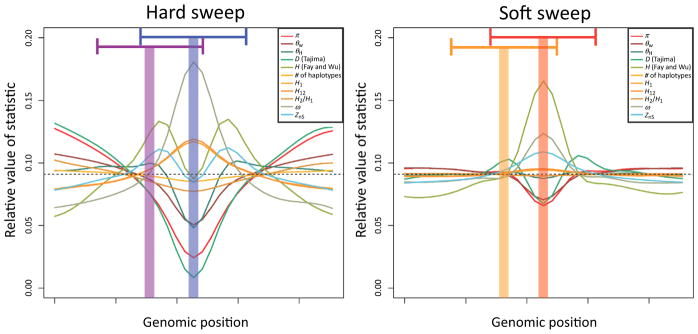
Figure III. A Visualization of S/HIC Feature Vector and Classes.
The S/HIC feature vector consists of π [77], [74], [34], the number (#) of distinct haplotypes, average haplotype homozygosity, H12 and H2/H1 [78,79], ZnS [37], and the maximum value of ω [48]. The expected values of these statistics are shown for genomic regions containing hard and soft sweeps (as estimated from simulated data). Fay and Wu’s H [34] and Tajima’s D [39] are also shown, though these may be omitted from the vector because they are redundant with π, , and . To classify a given region the spatial patterns of these statistics are examined across a genomic window to infer whether the center of the window contains a hard selective sweep (blue shaded area on the left, using statistics calculated within the larger blue window), is linked to a hard sweep (purple shaded area and larger window, left), contains a soft sweep (red, on the right), is linked to soft sweep (orange, right), or is evolving neutrally (not shown).

