Figure 5.
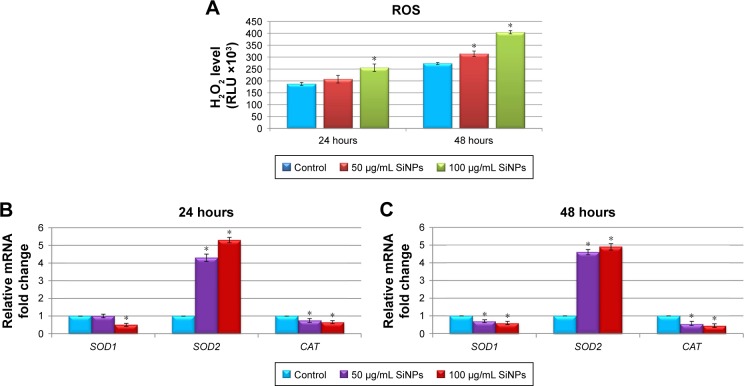
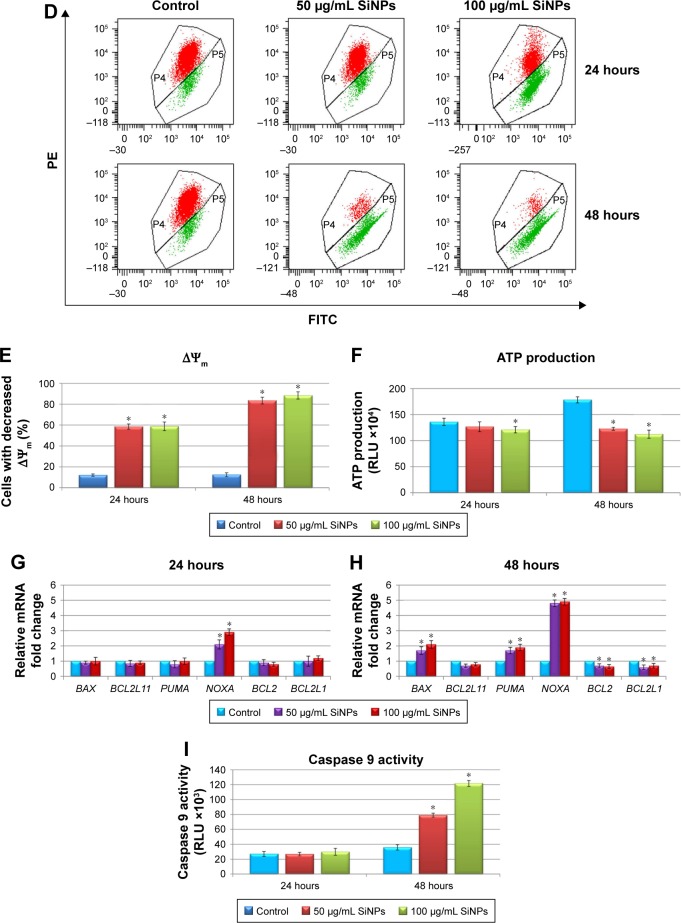
Effect of 5–15 nm SiNPs on oxidative stress and mitochondria dysfunction of glioblastoma LN229 cells.
Notes: ROS generation in LN229 cells subjected to treatment with 50 μg/mL and 100 μg/mL SiNPs for 24 hours and 48 hours (A). RT-qPCR analysis of antioxidant-enzyme genes SOD1, SOD2, and CAT in cells treated for 24 (B) and 48 (C) hours. Results shown as relative fold change in mRNA expression in comparison to untreated controls, where expression level was set as 1. Representative FACS data for LN229 cells subjected to JC1 staining (D). Gate P4 indicates cell population with normal ΔΨm, and gate P5 shows cell population with decreased ΔΨm. Percentage of cells with decreased ΔΨm (E). ATP levels in LN229 cells treated with SiNPs for 24 hours and 48 hours (F). RT-qPCR analysis of genes related to mitochondria dysfunction – BAX, BCL2L11, PUMA, NOXA, BCL2, and BCL2L1 – in cells treated for 24 (G) and 48 (H) hours. Results shown as relative fold change in mRNA expression in comparison to untreated controls, where expression level was set as 1. Caspase 9 activity (I). Mean values from three independent experiments ± SD are shown. *P<0.05.
Abbreviations: SiNPs, silicon dioxide nanoparticles; ROS, reactive oxygen species; RT-qPCR, reverse-transcription quantitative polymerase chain reaction; FACS, fluorescence-activated cell sorting; FITC, fluorescein isothiocyanate; PE, phycoerythrin; ΔΨm, mitochondrial membrane potential; JCI, 5,5,6,6-tetrachloro-1,1,3,3-tetraethylbenzimidazolcarbocyanine iodide.


