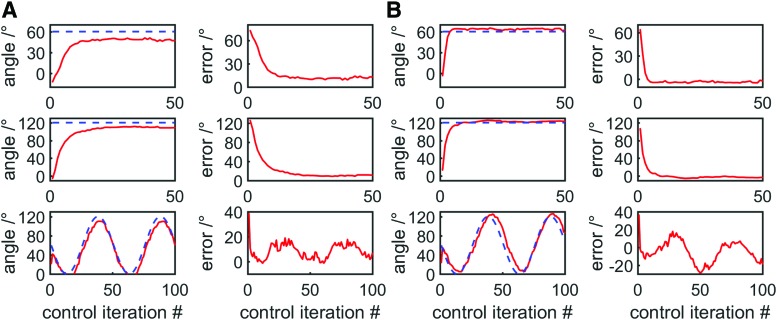
FIG. 15.
Position control tasks using resistance as a feedback variable, target bending angles are shown as dotted blue lines. From top: step function with an amplitude of 60°, step function with an amplitude of 120°, two periods of a 60° amplitude sinusoidal oscillation centered at 60°. The sensor model greatly influences results: (A) shows results using a cubic best fit of all resistance-length data, while (B) shows results using a cubic best fit of only inflating data. Color images available online at www.liebertpub.com/soro

