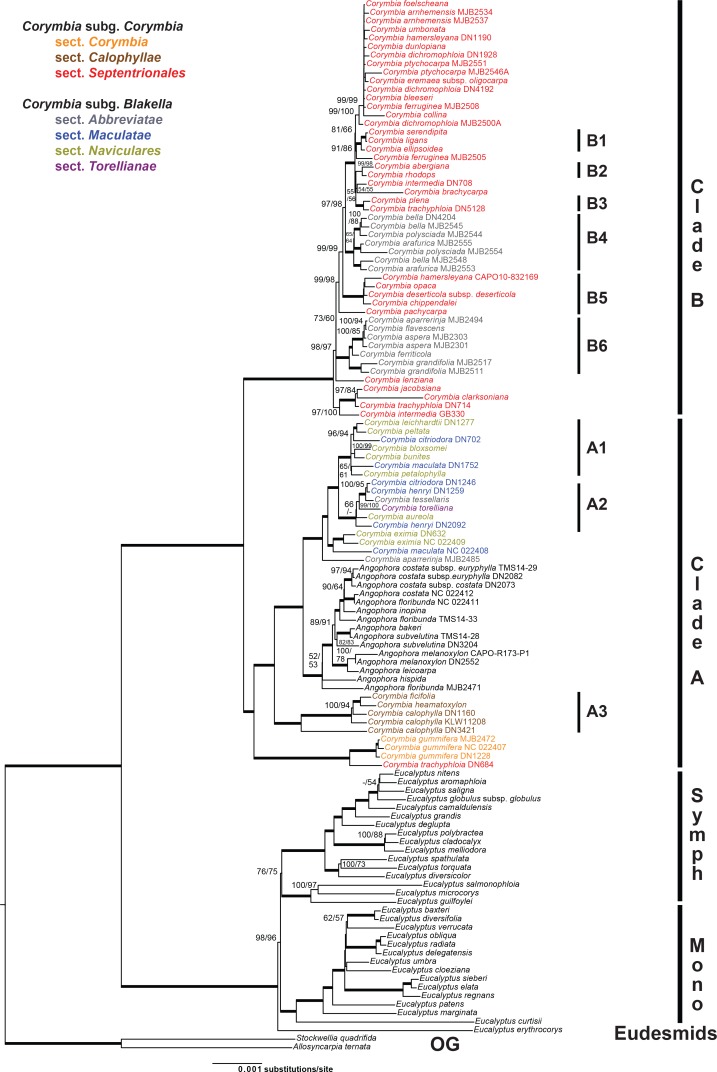
Fig 3. Phylogeny resulting from cpDNA analyses.
Best-scoring maximum likelihood tree from a RAxML analysis (final ML optimization likelihood of -254343.104231) of a cpDNA dataset (121,016 base pairs, 10,847 distinct alignment patterns, 123 accessions) of eucalypts. Names of Corymbia species are colour-coded by taxonomic section as indicated. Labelling to the right of the tree indicates the outgroup (‘OG’), major groups of Eucalyptus, including subg. Eudesmia (‘Eudesmids’), the symphyomyrt clade (‘Symph’; including subgenera Alveolata, Cruciformes Minutifructus and Syphyomyrtus), and the monocalypt clade (‘Mono’; including subgenera Acerosae, Eucalyptus and Idiogenes), as well as subclades of Corymbia clustering by geographic proximity (A1–A3 and B1–B6) referred to in the text and Fig 4 (for clade A) and Fig 5 (for clade B). Species names of species represented by multiple accessions are followed by collection number for newly generated sequences or GenBank accession number (NC) for data generated for previous studies. Bootstrap support values are shown as percent maximum likelihood/maximum parsimony (MP mapped onto ML tree) with weighted edges indicating 100% support for both ML and MP. Support values <50% are omitted or dashed when the alternate analysis method had ≥50% support.

