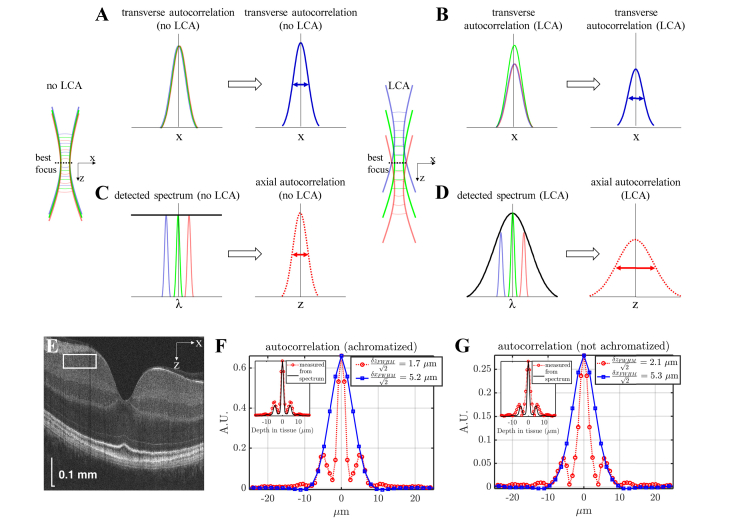
Fig. 2.
Assessing longitudinal chromatic aberration (LCA) in vivo from OCT speckle patterns. (A-B) A simple physical picture for the transverse autocorrelation based on Eq. (4). The transverse autocorrelation width is independent of defocus, and is the same with no LCA (A) and with LCA (B). However, with LCA (B), out-of-focus wavelengths are more weakly coupled, reducing the overall autocorrelation height and OCT signal level (B). (C-D) A simple physical picture for the axial autocorrelation based on Eq. (5). With no LCA, all wavelengths focus at the same axial plane, leading to uniform coupling across the spectrum (C), which maintains optimal axial autocorrelation width. However, with LCA, out-of-focus wavelengths are more weakly coupled, leading to unwanted shaping of the detected spectrum (D), which increases the axial autocorrelation width. (E) Ultrahigh resolution visible light OCT imaging of the macula (log scale) with a region-of-interest near the best focus to assess the complex speckle autocorrelation (F-G) Axial (dotted red) and transverse (solid blue) autocorrelations are shown. The best achievable axial (z) resolution, estimated from the spatial autocorrelation, was 1.7 µm full-width-at-half-maximum (FWHM) with achromatization (F) and 2.1 µm FWHM without achromatization (G). Sidelobes in the axial autocorrelation arise from ripples in the spectrum (insets in F-G show the Fourier transform of the spectrum squared). This represents a 20% improvement in the axial speckle size, achieved by achromatization. The transverse (x) resolution estimates based on the spatial autocorrelation were similar with and without achromatization (5.2 µm FWHM and 5.3 µm FWHM, respectively).

