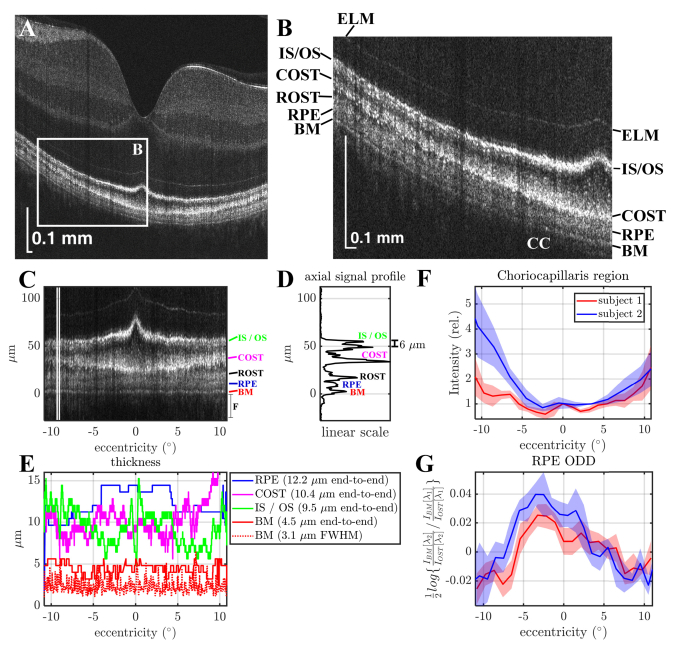
Fig. 5.
Human outer retinal morphometry with visible light OCT. (A-B) A single B-scan with a zoom of the outer retina shows a transition from the fovea to periphery. (C) Zoom of the outer retina after flattening. (D) Average axial signal intensity profile between the white lines in A. (IS / OS: Inner Segment / Outer Segment Junction, COST: Cone Outer Segment Tips, ROST: Rod Outer Segment Tips, RPE: Retinal Pigment Epithelium, BM: Bruch’s Membrane). In addition to delineation of the layers on a linear scale, two peaks are evident in the IS / OS band at 9° eccentricity. (E) Thickness measurements of the BM, IS / OS junction, COST, and RPE bands (assuming a refractive index of 1.4). (F) The signal from the choriocapillaris (CC) is lowest in the fovea (0° eccentricity), and increases with eccentricity. (G) The optical density difference (ODD) of the RPE (defined as the natural logarithm of the ratio of the BM to distal OST signal in the λ2 = 610 nm sub-band divided by the same ratio in the λ1 = 560 nm sub-band) shows a peak near the fovea (shaded areas show standard deviations across 5 scans) in agreement with expected RPE melanin distribution [33]. Subjects 1 and 2 are males of age 36 and 26 respectively.

