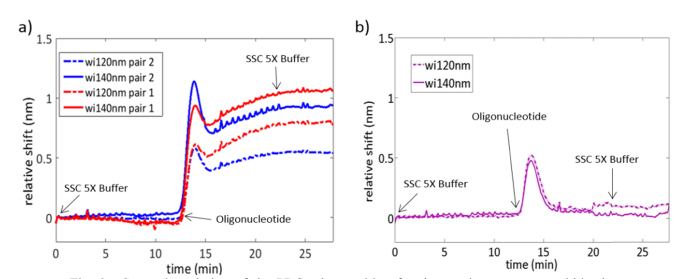
Fig. 8.
Spectral evolution of the PBG edge position for the sensing structures within the photonic chip when the target oligonucleotide is flowed over their surface. The sensing response for each PBG sensor pair is depicted in a different color and a different line format is used for each sensor within the pair (dashed line for wi = 120nm and solid line for wi = 140nm). (a) Sensing response for the PBG sensing structures being functionalized with the MB probes. (b) Sensing response for the PBG sensing structures blocked with BSA.

