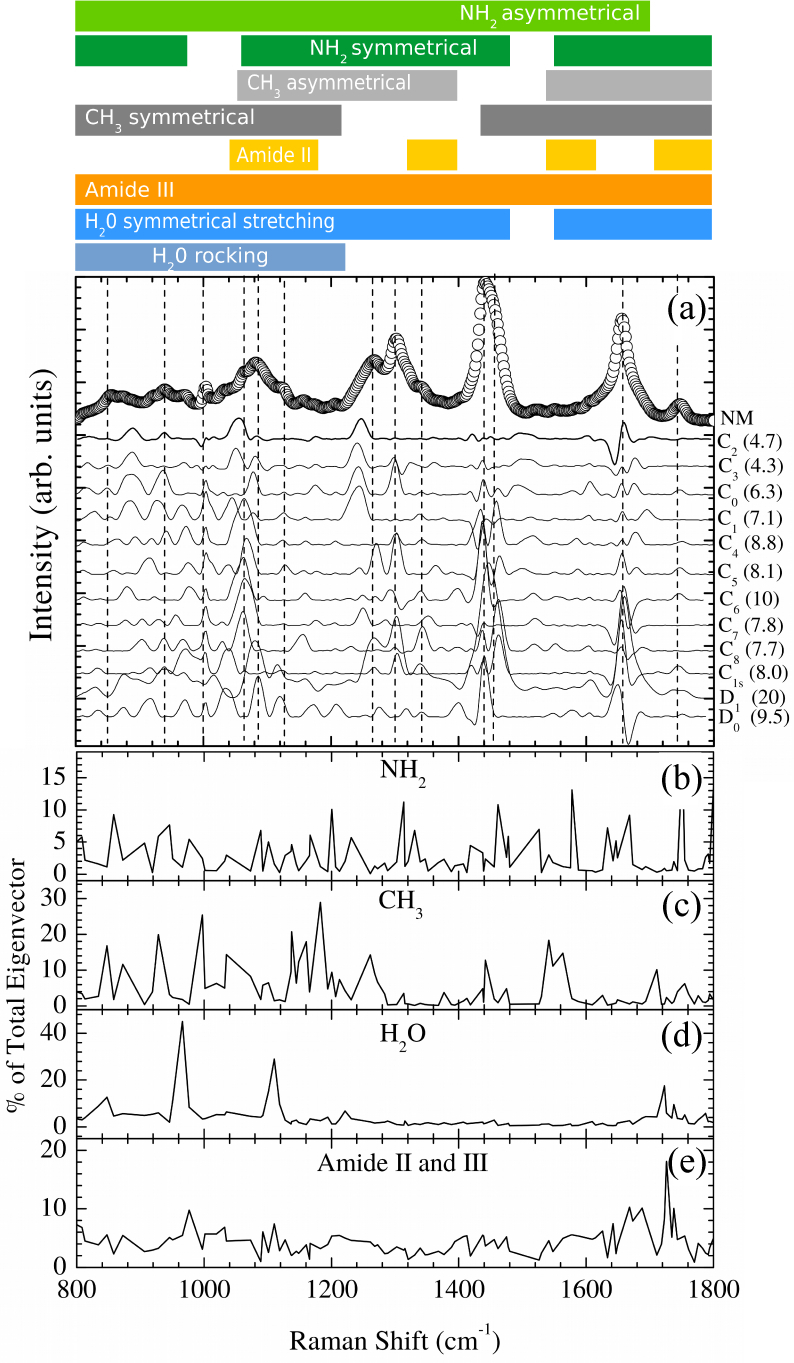
Fig. 2.

(a) Experimental FT-Raman spectra for normal oral mucosa tissue (circles, NM) compared to Cn(n = 0 – 8), C1s, D0, and D1 STmod models in the fingerprint region. Solid lines are the residuals of the experimental data fitted to each model. The fitting standard deviation (in 10−4 arb. units) in each case is shown in the right of each model symbol. The vertical dashed lines indicate the position of the thirteen more intense bands (≳ 10% of band of maximum intensity at ∼ 1440 cm−1). C2 and C3 lines represent those models with large set of experimentally represented bands. The wavenumber-axis projection of amine (b), methyl (c), water (d), and Amide II and III (e) partial eigenvectors contributions are also shown. The top scheme represents the qualitative additional bands assignment based on Table 1. Summary of experimental data acquisition details: Six pieces of biopsied NM tissues were investigated. The tissue samples were stored in liquid nitrogen (77K) in cryogenic vials prior to FT-Raman spectra recording. The Raman spectra were measured (300 scans) on 5 different points totalizing 30 spectra. A Bruker RFS 100/S FT-Raman spectrometer was used with a Nd:YAG laser operating at 1.064 nm as excitation light source. The laser power at the sample was kept at 230 mW and the spectrometer resolution was set to 4 cm−1. The samples were brought to room temperature and kept moistened in 0.9% physiological solution to preserve their structural characteristics, and placed in a windowless aluminum holder for the Raman spectra collection.
