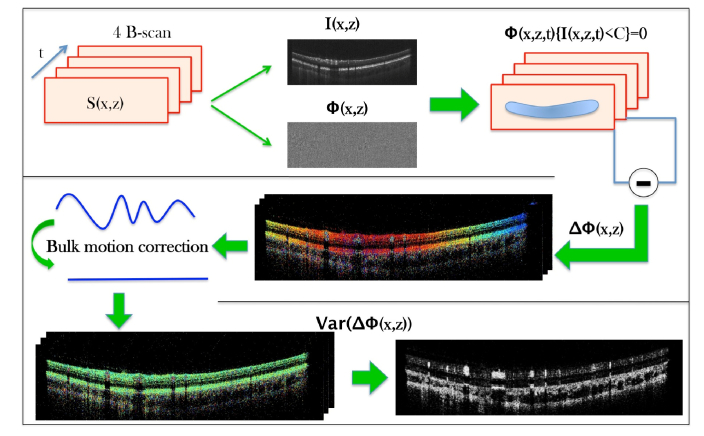
Fig. 2.
Flow diagram showing the individual post-processing steps for generating angiographic OCT data. Four B-scans that have been recorded at the same location are processed by intensity thresholding of the phase information and determining the phase variance within the set after correcting for bulk phase drifts. (t time, S recorded spectral data, I intensity, Φ Phase, C intensity noise floor ΔΦ phase difference between B-scans, Var Variance)

