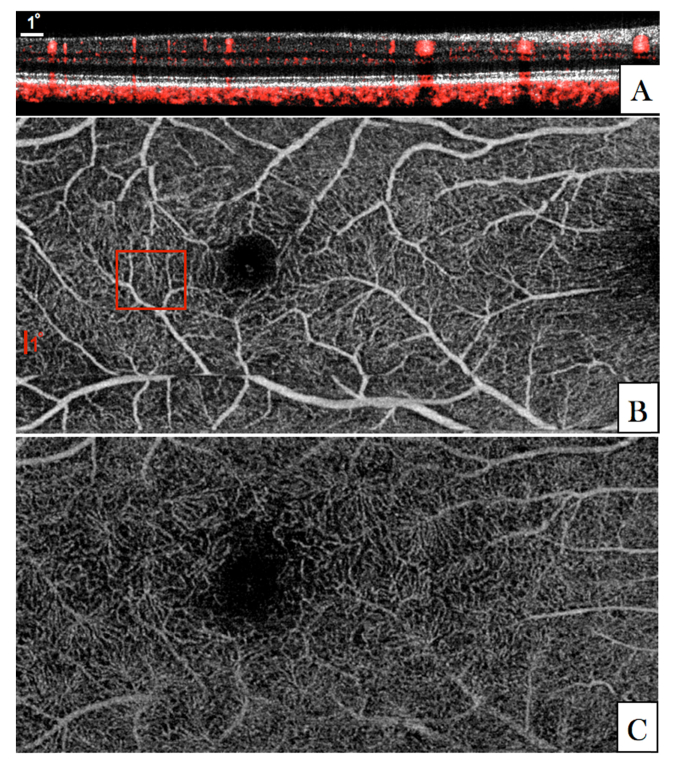
Fig. 6.
Angiographic images recorded in V2 with the medium FoV imaging mode (27°x13°). (A) Composite B-Scan showing the OCT intensity in linear grey scale and the calculated phase variance in red. The entire data set can be viewed in Visualization 5 (20.9MB, avi) . (B) En-face image generated by depth integration of angiographic data over the superficial plexus and the deep plexus. (The red square in (B) indicates the region of interest that was imaged with the AO-OCT imaging mode).

