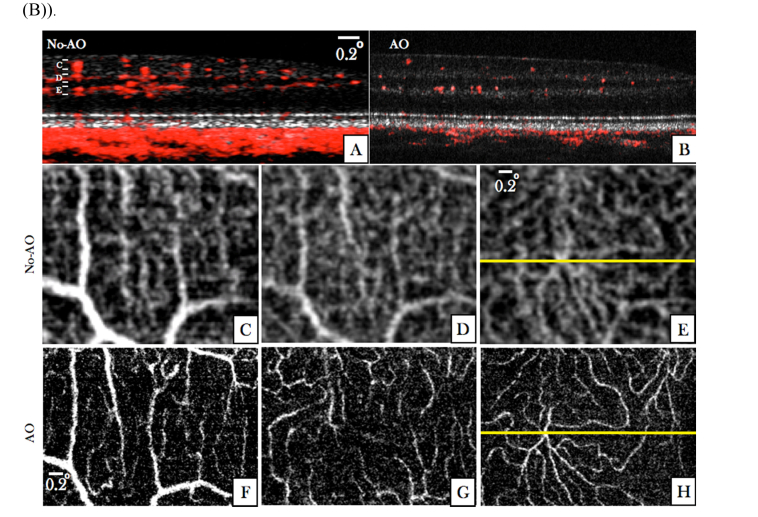
Fig. 7.
Angiographic images recorded in V2 with two different imaging modes (medium FoV mode and AO-OCT mode) at a location indicated with the red square in Fig. 6 (B). (A) Composite B-scan extracted from the data of Fig. 6 showing the OCT intensity information in gray scale and the phase variance in red. The depth extension of the different layers for en-projection are indicated by the letters C-D-E. (B) Composite B-scan recorded with the AO-OCT mode with the focus set at the inner layers. The intensity information is displayed in grey scale and the phase variance is displayed in red. (C-E) En-face phase variance images of the region of interest extracted from data of Fig. 6 of the superficial, intermediate and deep plexus, respectively. (Note that these images are enlarged views of the data presented in Fig. 6) The entire data set can be viewed in Visualization 6 (4.5MB, avi) . (F-H) En-face images of the phase variance recorded with the AO-imaging mode by depth integration over the superficial plexus, intermediate plexus and deep plexus, respectively. The horizontal yellow line indicates the location of the B-scans.

