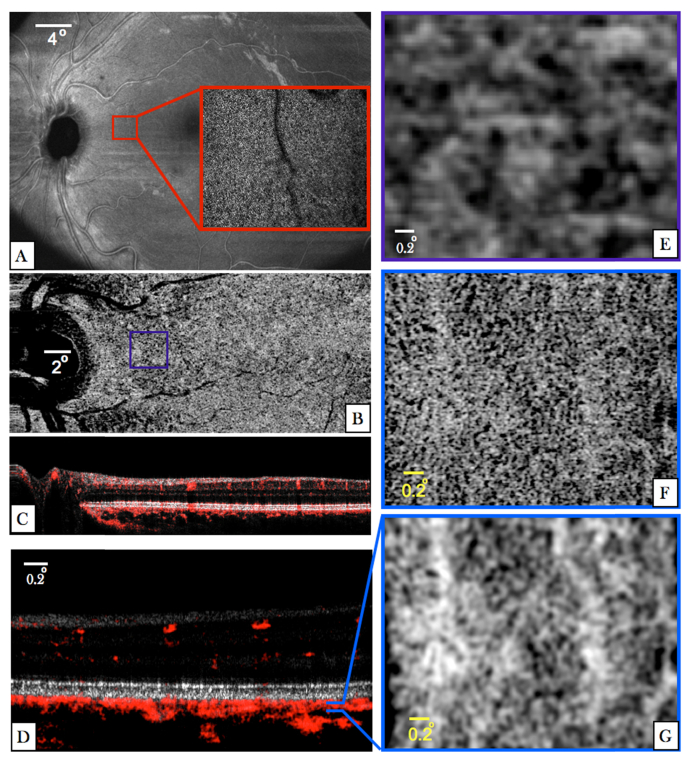
Fig. 8.
Images recorded with all three imaging modes in the left eye of V3. (A) En-face image recorded with the large FoV mode and generated by depth integration along the entire A-scan. (The red square indicates the region of interest and corresponds to 3° × 2.8° at an eccentricity of ~7.5 degrees from the fovea). The inset represents an en-face image recorded with the AO-OCT mode and was generated by depth integration over the IS/OS layer. (B) En-face image generated from the medium FoV mode by depth integration of OCTA data posterior to the RPE. (C) Composite image of OCT B-scan intensity information in linear gray scale and the phase variance in red of the medium FoV mode. (D) Composite AO-OCT B-scan with the focus set at the photoreceptor layer displaying the OCT intensity on a linear grey scale and the phase variance in red. (The entire data set can be viewed in Visualization 7 (3.4MB, avi) ) (E) Enlarged view of the region indicated by the purple square in (B). (F) En-face image generated from AO-OCT data by depth integration over a shallow slab (10 pixels) posterior to the RPE. (G) Image data from (F) after applying a Gaussian blur filter (3pixels).

