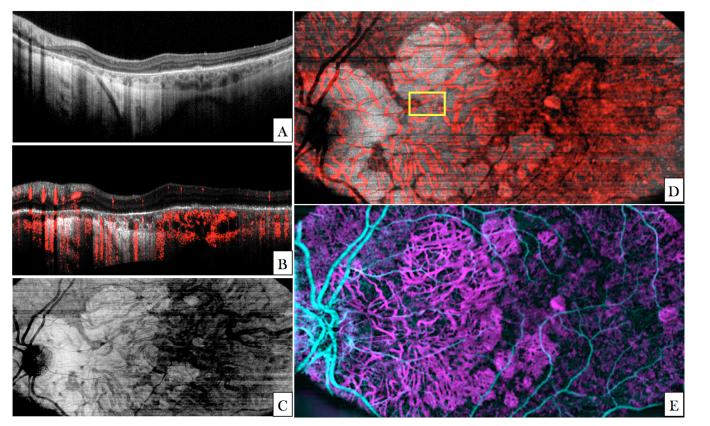
Fig. 9.
Images recorded with the large FoV mode in a patient with geographic atrophy. (A) Central B-scan showing the atrophic zone on the left half of the image. (B) Flattened central B-scan with angiographic information overlaid in red. (C) En-face image generated by depth integration of the volume data posterior to RPE/Bruch’s membrane. (D) The same en-face image as shown in (C) with the angiographic information overlaid in red. (The yellow square indicates the region of interest that has been imaged with AO-OCT- cf. Fig. 10). (E) Composite image generated by angiographic evaluation of the data visualizing vasculature of the inner retina (cyan) and choroid (magenta).

