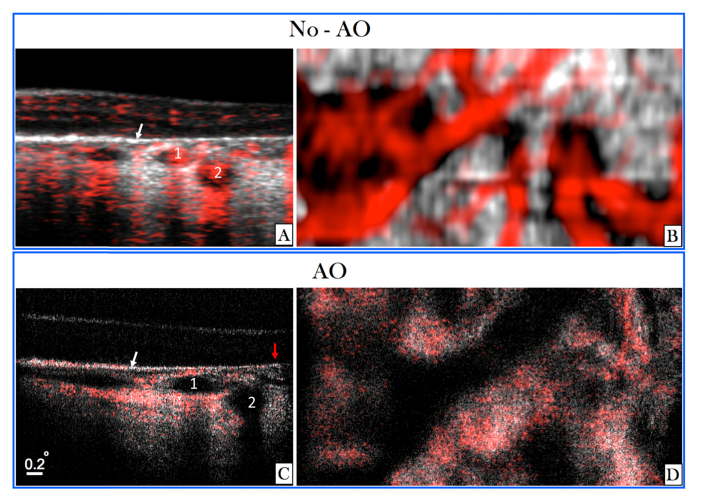
Fig. 10.
Images recorded in a patient with geographic atrophy in the region of interest indicated in Fig. 9(D)). A) Composite B-scan recorded with the large FoV mode showing OCT intensity and angiographic information overlaid in red (enlarged view of the region of interest approximately corresponding to the location displayed in C). The white arrow indicates the border between atrophic and non-atrophic region. The numbers 1 and 2 indicate two vessels. B) Corresponding en-face projection over the depth extension of choroid of the large FoV data. C) Composite B-scan recorded with the AO-OCT imaging mode. The numbers 1 and 2 indicate the same two vessels that are displayed in A). The red arrow indicates a location without larger choroidal vessels. D) En-face projection of AO-OCT data (over the depth extension of choroid).

