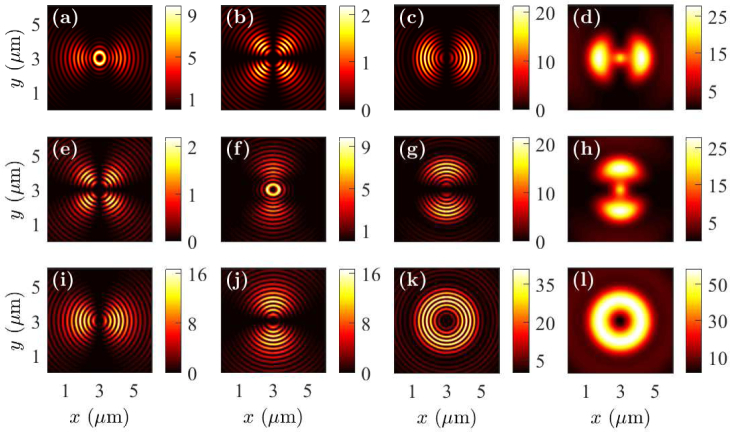
Fig. 2.
Near-field profiles in the x-y plane when the fluorophore is on the top of cell debris with the dipole oriented in the (a)–(d) x-direction, (e)–(h) y-direction, and (i)–(l) z-direction. Electric field components |Ex|2 are drawn in (a), (e), and (i); |Ey|2 are drawn in (b), (f), and (j); |Ez|2 are drawn in (c), (g), and (k); and |Ex|2 + |Ey|2 + |Ez|2 are drawn in (d), (h), and (l).

