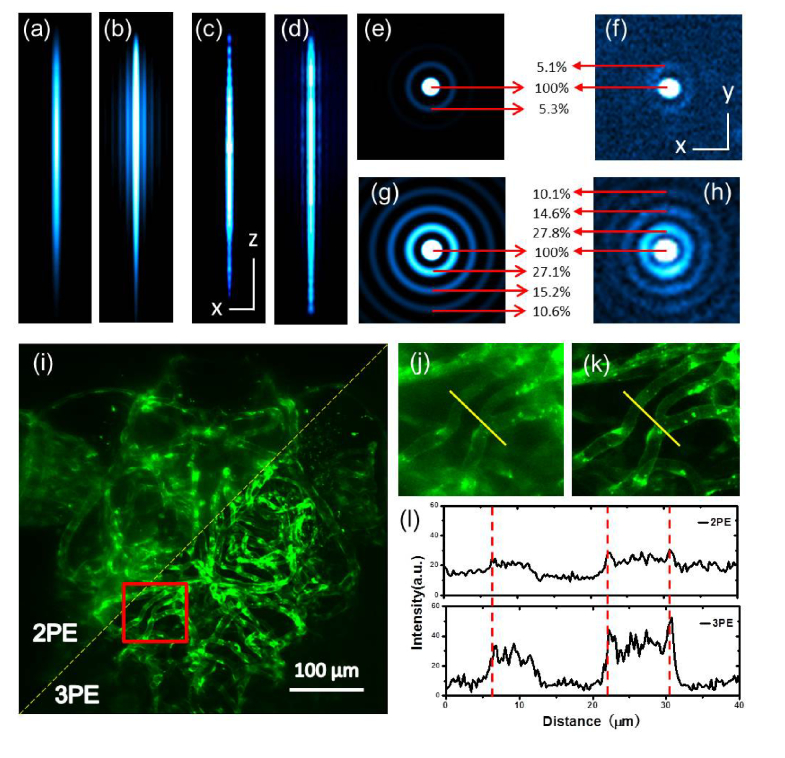
Fig. 2.
Theoretically simulated and experimentally determined PSFs. (a)(b), simulated PSFs of 3PM and 2PM along the x-z planes. (c)(d), the experimental results. Scale bars, 100 μm (z), 2 μm (x). 0.5-μm fluorescent beads were used to measure xyz profiles of Bessel-3PM and Bessel-2PM. (e)(g), x-y cross section after integration of the z-axis of the Bessel beam to numerically simulate the fluorescence distribution of the side lobes (e, 3PM; g, 2PM), (f)(h), the experimental results. Scale bar, 2 µm. (i-l), comparison of blood vessels in live zebrafish imaged with Bessel-3PM and 2PM. (i), a representative example of the fish under Bessel 2PM and 3PM, in which the boxed region was magnified in j and k. (l), fluorescence intensities along the line across the same blood vessels.

