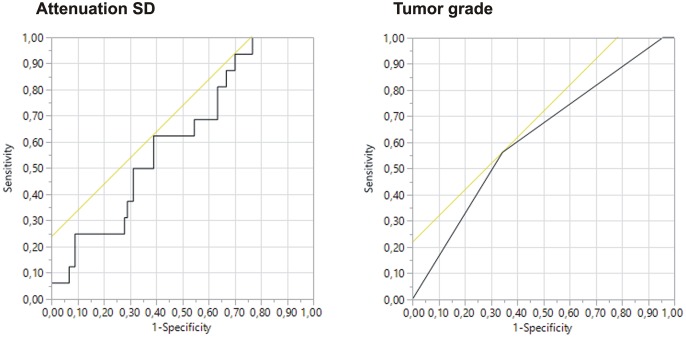
Fig 4. Receiver operating characteristic (ROC) curves for the standard deviation of CT attenuation values (attenuation SD) and tumor grade for prediction of perioperative complications.
Under all reference-corrected values, the standard deviation of the CT attenuation was the only parameter with an AUC > 0.6. In comparison, the ROC curve for the tumor grade is given.

