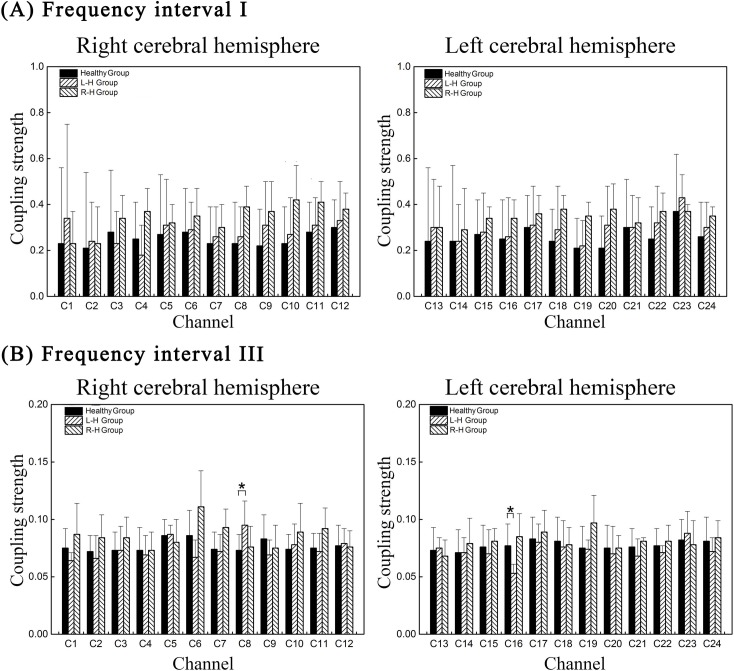
Fig 3. Group statistical analysis in channel-wise CS from MAP to delta [HbO2] in different frequency interval.
(A) channel-wise CS in frequency interval I (B) channel-wise CS in frequency interval III. Each column shows the CS mean and SD of a specific effective coupling interaction for different groups. The healthy, L–H and R–H groups are represented by different columns as illustrated by the legend in the figure. The line connectors and ‘*’ on the top of individual columns indicate that the difference between the two column distributions was statistically significant.

