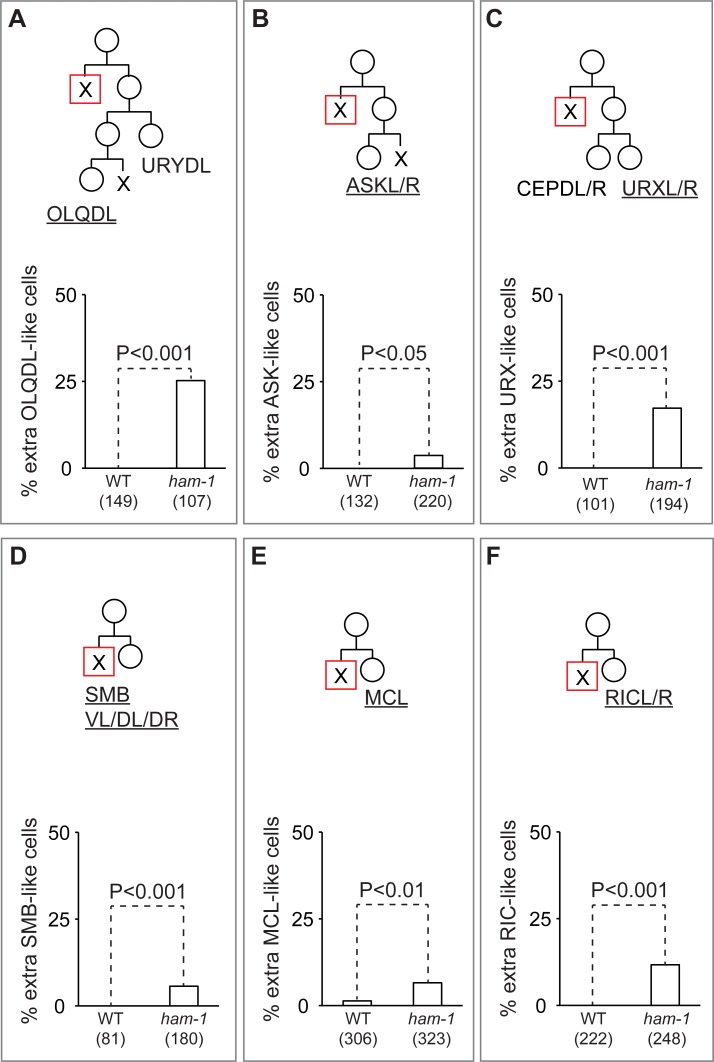
Fig 2. Abnormal numbers of neurons in nine neuroblast lineages that produce an anterior apoptotic daughter cell.
(A) OLQDL, (B) ASKL/R, (C) URXL/R, (D) SMBVL/DL/DR, (E) MCL and (F) RICL/R lineage diagrams (upper panels) and the frequency of at least one extra neurons produced in wild-type (WT) and ham-1 mutant animals (lower panels). For each lineage, the neurons labelled are underlined on the diagram. Cells fated to die are indicated by an x, the anterior dying cell in each lineage is indicated by an x in a red square. The number of animals scored is indicated in parenthesis below each genotype.

