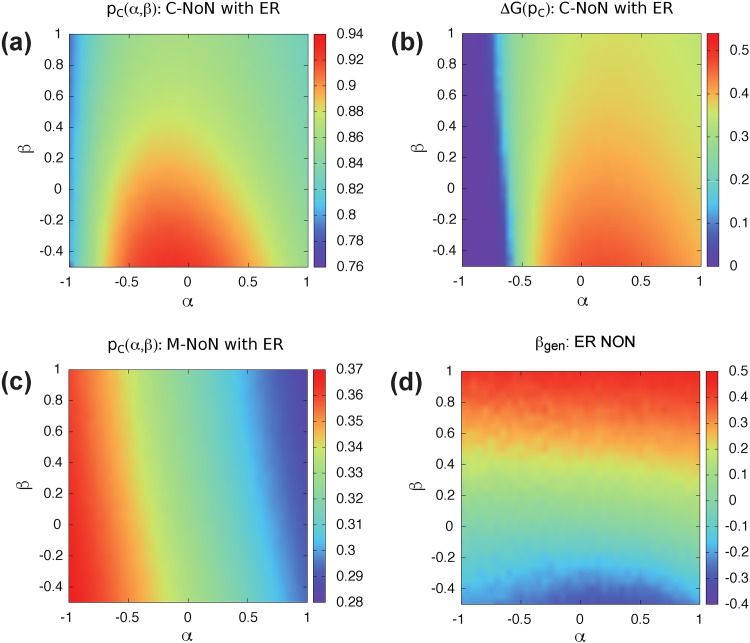
Fig 4.
(a) Percolation threshold and (b) size of jump of C-NoN in correlated ER NoN with N = 104, 〈kin〉 = 2, and 〈kout〉 = 1 for different α and β. When α ≈ −1 or α > 0.5 and β > 0, NoN becomes stable against random failure. In contrast, when −0.5 < α < 0.5 and β < 0, NoN is vulnerable to catastrophic collapse. (c) percolation threshold of M-NoN with correlated ER NoN with the same parameters as C-NoN. High α and β region is robust against random failure for M-NoN. (d) βgen observed from realized networks at a given (α, β). The value βgen is obtained by a linear regression.

