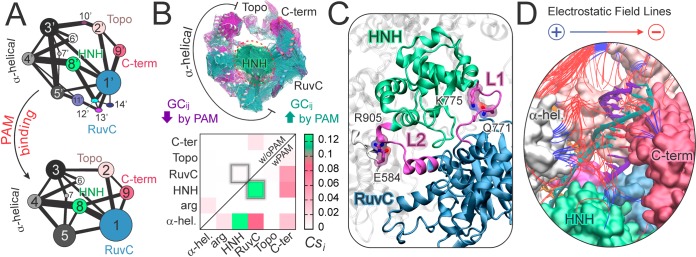
Figure 3.
(A) CNA of Cas9–w/oPAM (top) and wPAM (bottom), shown in a 2D representation of the community network. Bonds connect communities and measure their intercommunication strength. (B) GCij increased (green) and decreased (magenta) by PAM are plotted on the 3D structure (top), indicating an increase of intercorrelations involving the HNH domain. A per-domain correlation score (Csi) matrix (bottom) measures the interdomain correlations wPAM (lower triangle) and w/oPAM (upper triangle). Two boxes highlight the HNH–RuvC intercorrelation. (C) Interactions between essential edges of the allosteric pathway (Q771–K775 and E584–R905), involving the L1 and L2 loops (magenta), which interconnect HNH (green) and RuvC (blue). (D) Electrostatic properties of Cas9–wPAM. Field lines indicate the direction of the electrostatic field from positive (blue) to negative (red) regions. Field lines are filtered according to a gradient magnitude >4.9 kT/e/Å and length >13.5 Å.

