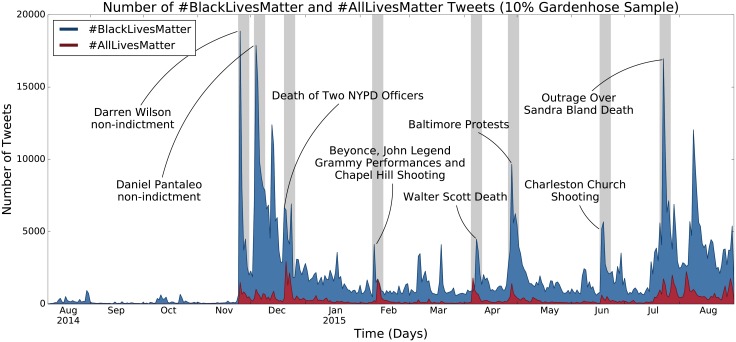
Fig 1. Time series showing the number of #BlackLivesMatter and #AllLivesMatter tweets from Twitter’s 10% Gardenhose sample.
The plot is annotated with several major events pertaining to the hashtags. Shaded regions indicate one-week periods where use of both #BlackLivesMatter and #AllLivesMatter peaked in frequency. These are the periods we focus on in the present study.

