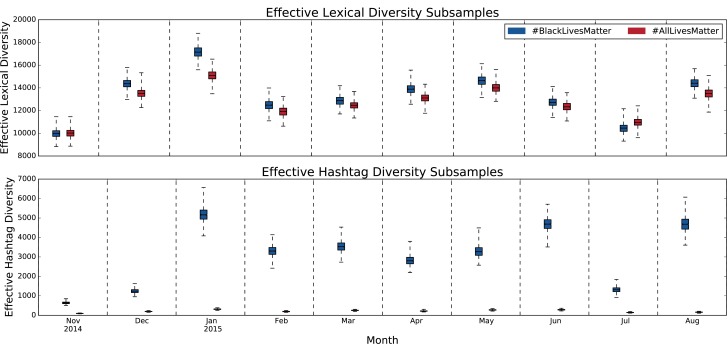
Fig 8. Notched box plots depicting the distributions of subsamples for effective lexical and hashtag diversity.
To control for how volume affects the effective diversity of #BlackLivesMatter and #AllLivesMatter, we break the time scale down into months and subsample 2,000 tweets from each hashtag 1,000 times. The notches are small on all the boxes, indicating that the mean diversities are significantly different at the 95% confidence level across all time periods.

