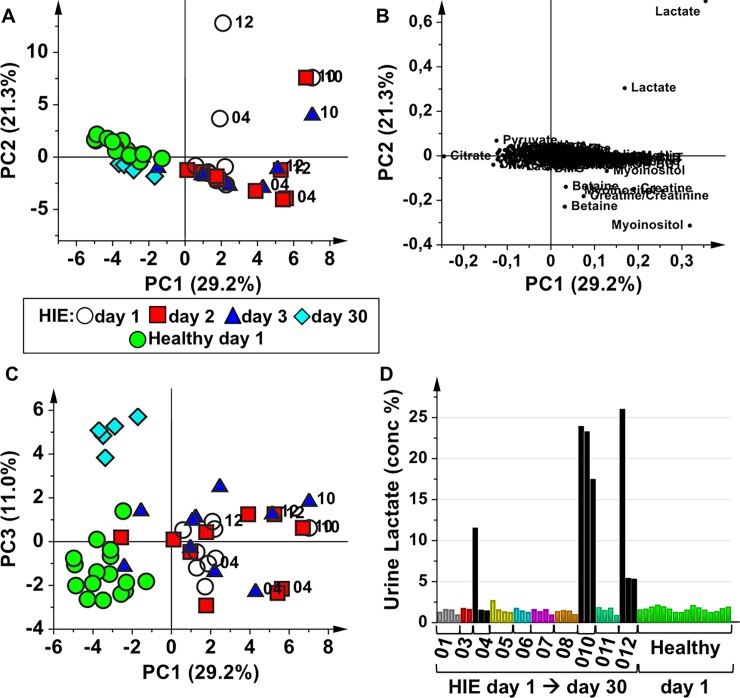
Fig 1. Overview of the collected urine samples from HIE newborns and healthy controls.
PCA model of urine samples collected from HIE newborns at birth (HIE day 1, open circles) and at different time points after birth: HIE day 2 (48 hours during TH, red squares), HIE day 3 (end of the TH, blue triangles), HIE day 30 (light blue diamonds), and from healthy control newborns at birth (Healthy day 1, green circles). (A) score plot of PC1 vs PC2; (B) loading plot of of PC1 vs PC2; (C) score plot of PC1 vs PC3; (D) urine lactate relative concentration, obtained from the integrated area of the spectral region 1.32–1.36 ppm normalized to the total integrated area. For HIE babies urine lactate relative concentration is reported for all the sampled time-points (from day 1 to day 30, except for non-surviving newborns), while only the concentration at birth is reported for the control newborns.

