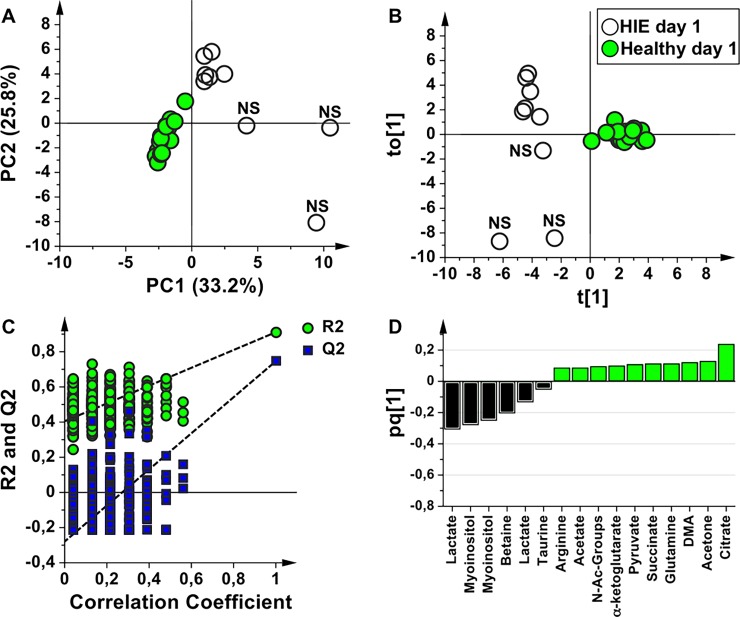
Fig 2. Comparative analysis of urine samples of HIE newborns and healthy controls at birth.
Score scatter plots of (A) PCA and (B) OPLS-DA models of urine samples collected from HIE newborns (HIE day 1, empty circles) and from healthy newborns (Healthy day 1, green circles). The label NS indicates the non-surviving babies. (C) Permutation test of the corresponding PLS-DA model (n = 400 random permutations). (D) OPLS-DA loading column plot of discriminant variables.

