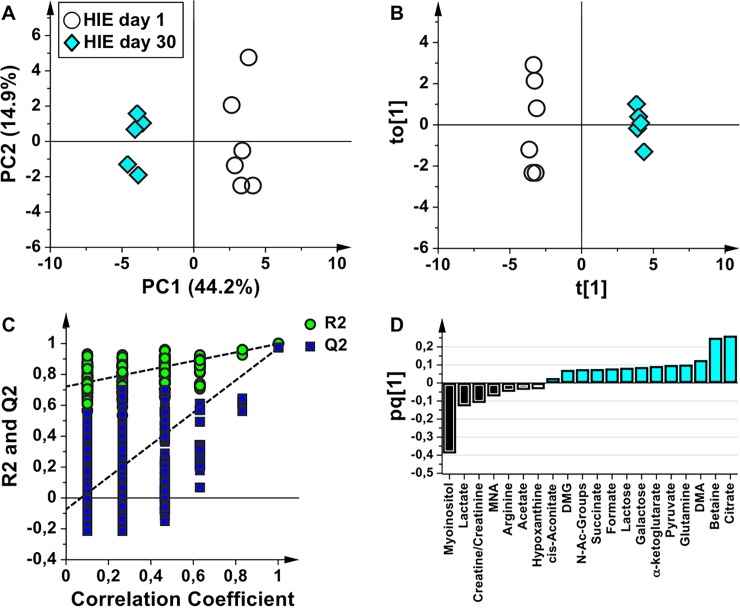
Fig 5. Comparative analysis of urine samples of HIE newborns at birth and at 30 days of life.
Score scatter plots of (A) PCA and (B) OPLS-DA models of urine samples collected from HIE babies at birth (HIE day 1, empty circles) and at 30 days of life (HIE day 30, light blue diamonds). (C) Permutation test of the corresponding PLS-DA model (n = 400 random permutations). (D) OPLS-DA loading column plot of discriminant variables.

