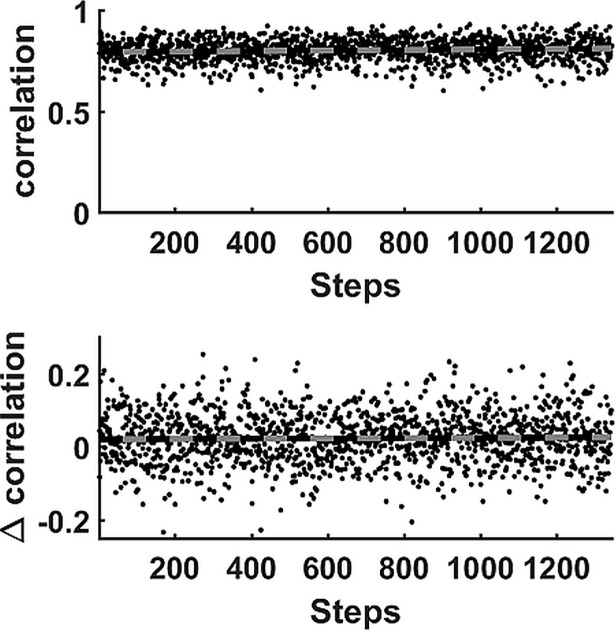
Fig 4. Stepwise correlations.
Correlation analysis for subject#10: Top: The correlations where the WIPs were obtained from the VM and VL muscles during the same step. These correlations occasionally show a significant change over time. The computed trend line indicates that the correlation increased systematically while running. Bottom: The paired differences in correlation between the WIPs that were obtained from the VM and VL muscles during the same step and those obtained during consecutive steps. This eliminates the effect of the trend (the trend line shows no significant slope) and allows measuring the small absolute paired differences reported in Table 1.

