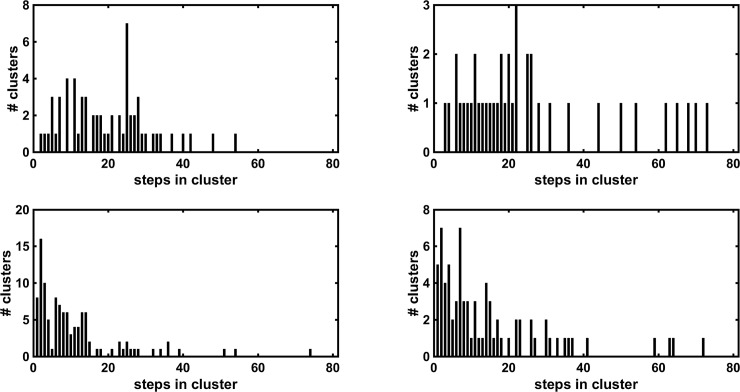
Fig 6. Histograms of cluster sizes.
Histograms of subject#4 showing the number of clusters containing a certain number WIPs of steps per cluster. The top graphs show the results for VM and VL whereas the bottom ones the results of the corresponding surrogate WIPs. The surrogate WIP show more clusters with a smaller cluster size (Table 1).

