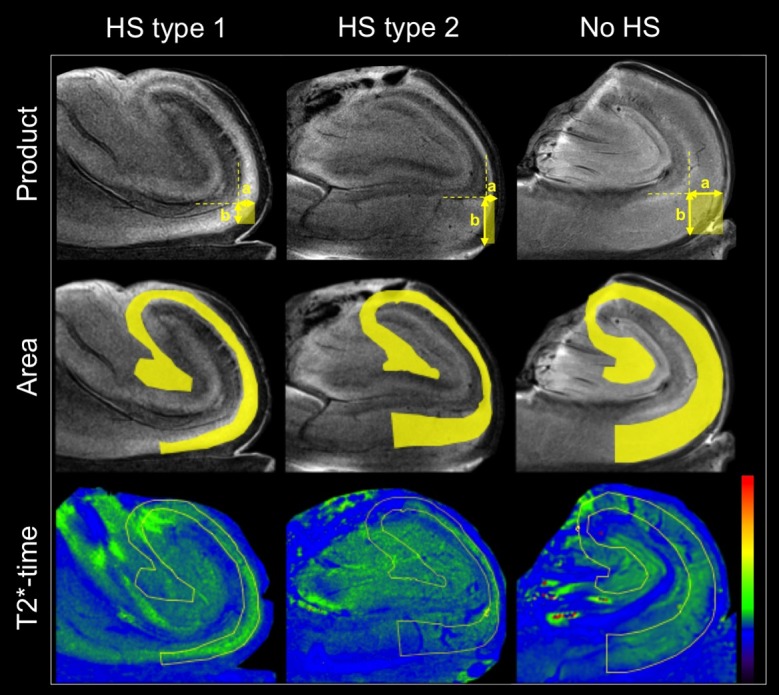
Fig 2. Illustration of the quantitative MR-parameters product and area, including color-coded maps of T2*-time of HS type 1, HS type 2 and no-HS hippocampi.

The parameter product, as is exemplarily shown in the upper row, is derived by multiplying widths a and b of the PCL and can be illustrated as a rectangle. The parameter area (second row) refers to the area of the PCL, which is skirted by the segmentation mask, shown in yellow. T2*-time is determined as mean value within the segmentation mask, defining the area of the PCL.
