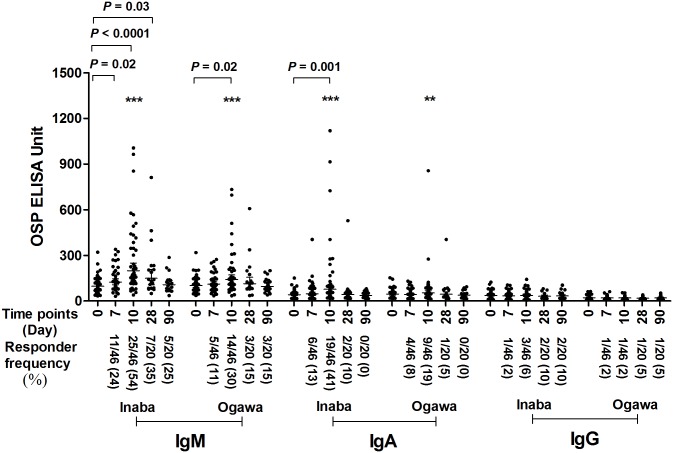
Fig 1. Serum IgM, IgA and IgG responses targeting V. cholerae O1 Inaba or Ogawa OSP in vaccine recipients of CVD 103-HgR.
Figure only contains results for samples collected prior to wild type experimental V. cholerae challenge. Day 0 is pre-vaccination and other dates are timed from vaccination. In total, 46 vaccinees are included until day 10, then 20 vaccinees until day 90. X axis indicates the time points of samples while Y-axis denotes OSP-specific antibody responses. Each single dot indicates an individual OSP antibody value, horizontal bars indicate the geometric mean (GM), and error bars indicate 95% confidence intervals. P values represent significant differences of the mean between groups. Asterisks represent differences in responder frequency in Fisher’s exact test (*** P ≤ 0.001, ** P ≤ 0.01). We defined a responder as having a ≥1.5-fold increase in anti-OSP units after vaccination compared to pre-vaccination value. Responder frequency is represented in parenthesis on x-axis.

