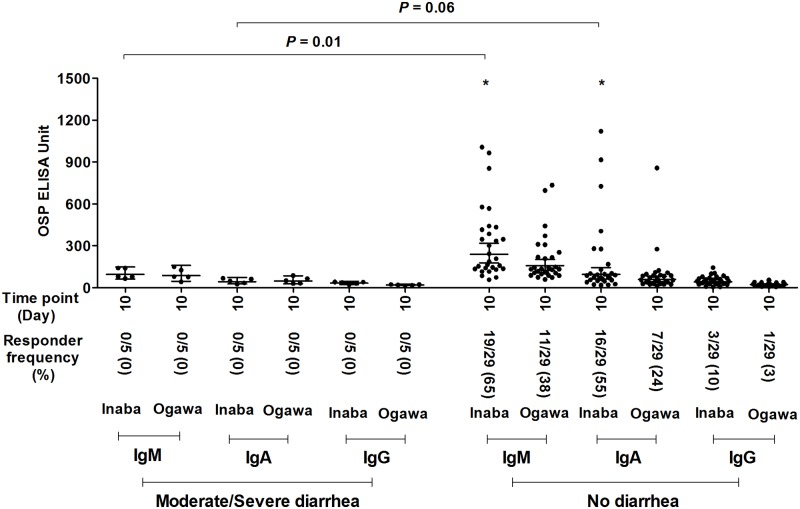
Fig 4. Serum IgM, IgA and IgG antibody responses targeting V. cholerae O1 Inaba and Ogawa OSP 10 days after oral vaccination.
The figure shows the OSP specific antibodies responses 10 days after vaccination in volunteers who developed moderate (≥3L) or severe (≥5L) diarrhea versus no diarrhea following wild type V. cholerae O1 Inaba experimental infection 10 or 90 days after vaccination. X axis indicates the time points of samples while Y-axis denotes OSP specific antibody responses. Each single dot indicates an individual OSP antibody value, horizontal bars indicate the geometric mean (GM), and error bars indicate 95% confidence intervals. Responders were defined as having an increase in kinetic ELISA units ≥ 1.5 fold on day 10 post-vaccination compared with day 0 pre-vaccination. Asterisk indicates statistical significant difference (* P ≤ 0.05) of responder frequency between no diarrhea versus moderate/severe diarrhea group in Fisher’s exact test.

