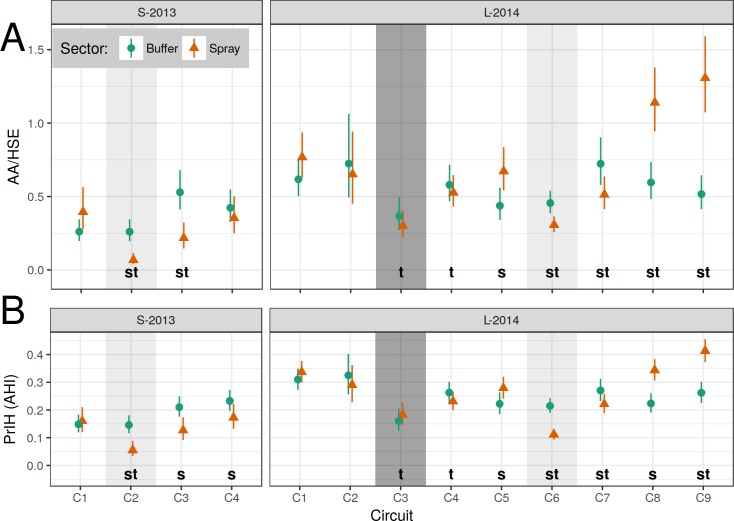
Fig 4. Model estimates of Ae. aegypti adults per house (AA/HSE, top row) and proportion infested houses (PrIH = AHI).
A separate generalized linear model (GLM) was constructed for each experiment (column) and for each measured response (row). (A) AA/HSE, negative binomial GLM (NB-GLM). (B) PrIH, logistic GLM (L-GLM). Models describe response of measure (row) to time period (X-axis) and treatment sector (color & shape). Shading indicates spray events: experimental spraying (light) and citywide spraying (dark). Vertical bars show 95% CI; non-overlapping CI indicate highly significant difference. Letters (s, t) indicate significant differences between pairwise contrasts: s, between sector (within time, S2 Table); t, between time (within spray sector, relative to baseline C1, S3 Table). See also S6A and S6B Table, S7A and S7B Table, and S5 Fig.

