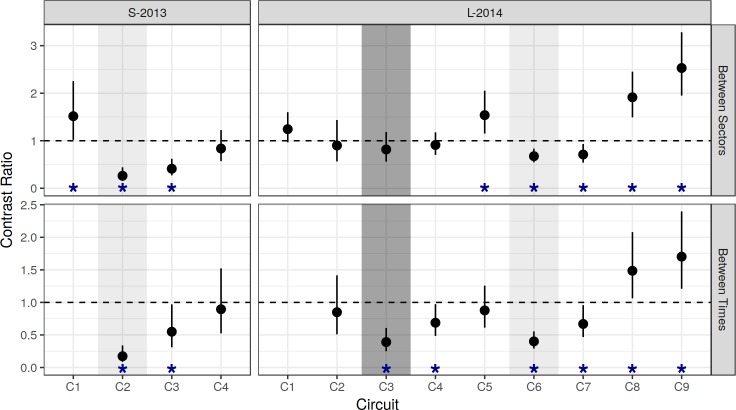
Fig 5. Contrast ratios of AA/HSE, based on NB-GLM.
Results from NB-GLM models (Fig 4A). Top row (between-sector): Spray/Buffer. Bottom row (between-time, within spray sector): contrast relative to baseline (C1). Vertical bars show 95% CI. Horizontal dashed line indicates null hypothesis of equality (H0: ratio = 1). Asterisks (*) indicate significant difference between pairwise contrasts (reject H0).

