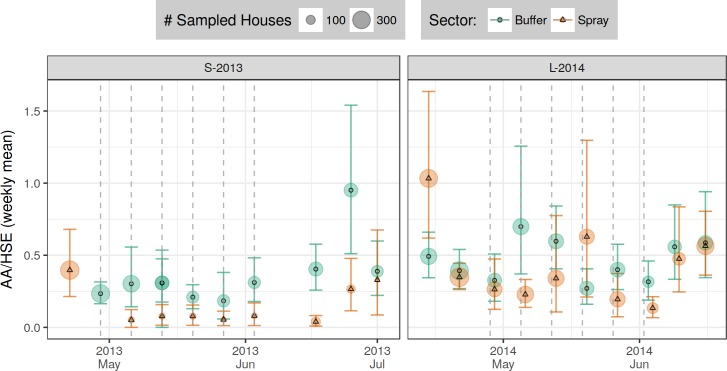
Fig 6. Detailed time series of AA/HSE response to ULV spraying, aggregated by week.
X-axis shows week start date. Color and symbol shape shows sector (orange triangle: spray sector). Point size shows number of surveyed houses. Vertical dashed lines show approximate dates of experimental spraying (spray sector only). Vertical colored bars show bootstrap 95% CI (1e+04 draws per circuit).

