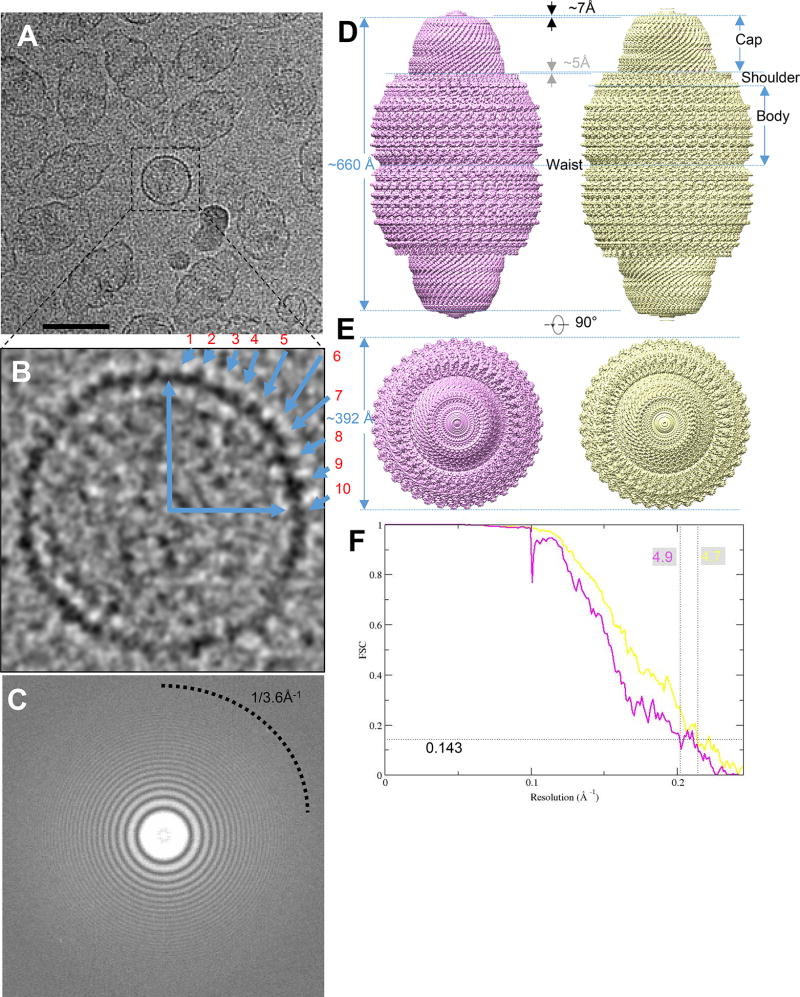
Figure 1. CryoEM single particle analysis result on engineered MVP-only vault.
(A) Aligned sum of rat vault raw image stack, showing this dataset has nice orientation distribution. Typical top views are boxed in black square. The scale bar is 50nm. (B) Magnified raw image of top view to show there are ~10 copies in a quadrant of circle, implying close to 40-fold related symmetry. (C) Fourier transform of a sum micrograph. Thon rings can reach to water signal at close to 3.6Å−1. (D) Density map of two vault conformations refined from a single dataset. Conformation 1 (displayed at 4.4 σ) is in pink and conformation 2 (displayed at 4.5 σ) is in yellow. They are all in D39 symmetry. (E) top view of vault density in (D). No diameter change can be observed. (F) FSC curve showing that the resolution (FSC 0.143) of the two conformations are 4.9 Å and 4.7 Å, respectively.

