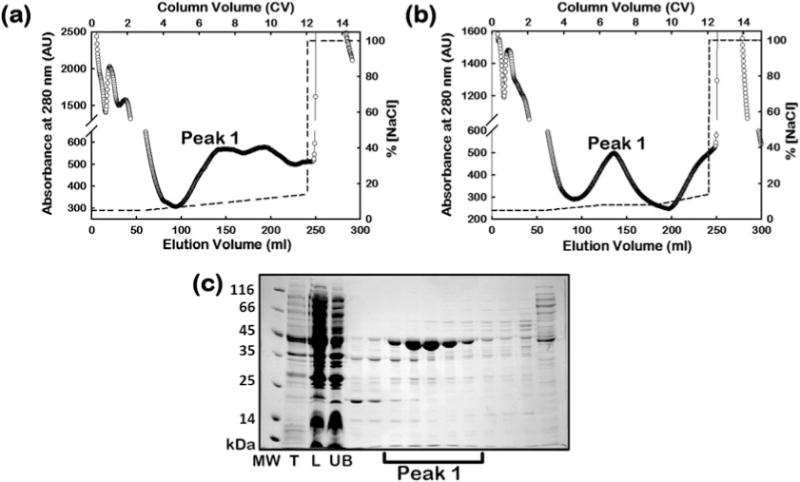
Fig. 2.

Step 1 of the AAT protein purification process. FPLC chromatogram of AAT in the supernatant (labeled “L”) eluted from the Q Sepharose Fast Flow column using (a) a continuous linear salt gradient method, or (b) a 3-step gradient method. SDS-PAGE of fractions eluted from column 1 in (b) is shown in panel (c). The fractions within peak 1 contain AAT. The dashed line shows the salt gradient used for elution. The labels, T and UB, denote the total cell lysate and flow through fraction from the column respectively
