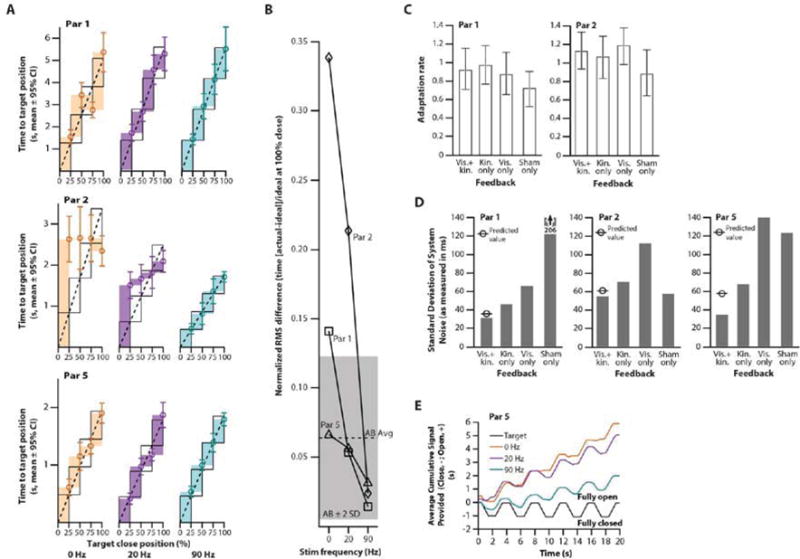
Fig. 3. Performance in functional tasks with and without vibration-induced kinesthetic illusory feedback.

(A) Three participants’ (Par 1, Par 2, and Par 5) ability to accurately reach proportioned intervals in a grip-conformation task (25%, 50%, 75%, 100% hand closed) while receiving no (0 Hz, orange), 20 Hz (purple), and 90 Hz (teal) vibratory feedback. Actual intervals between targets (colored rectangles) are compared to the ideal intervals fit to each participant’s actual performance times (black open rectangles). The actual times to target position are shown as circles with error bars indicating 95% confidence intervals (n=20), which specify the height of the colored rectangles. The ideal change in time to target position between percent close positions (black open rectangles) is specified by the linear regression with intercept set at zero (black dotted line). Alignment between the black open rectangles and the colored rectangles is an indication of the participant’s ability to reach the proportional degrees of closure. (B) Line graph showing degree of alignment with ideal proportional performance in the grip-conformation task shown in panel A for amputee participants (Par 1, Par 2, and Par 5) and in an analogous task for an able-bodied cohort (AB Avg, n=5, Fig. S4B). The black dashed line indicates the average performance of able-bodied (AB Avg) participants ± 2 standard deviations (grey shaded area). (C) Bar graph showing average adaptation rate to self-generated error for Par 1 and Par 2 in different feedback conditions (vis.+kin. = vision and kinesthesia; kin. only = kinesthesia only; vis. only = vision only; sham only = 20 Hz vibration). Error bars represent 95% confidence intervals (n=75-95 trials). (D) Bar graph showing the standard deviation of the overall system noise (see methods for details) for Par 1, Par 2, and Par 5, for different feedback combinations (vis.+kin. = vision and kinesthesia; kin. only = kinesthesia only; vis. only = vision only; sham only = 20 Hz vibration). (E) Graph of cumulative EMG control signal trajectories for Par 5 using an agonist-antagonist muscle pair (biceps, hand close; triceps, hand open). Average cumulative control signal trajectories (n=4 trials, time the participant provided a close signal [negative] plus the open signal [positive]) for each feedback condition (90 Hz [teal line], 20 Hz [purple line], or no vibration [orange line]) compared to the target trajectory (black line).
