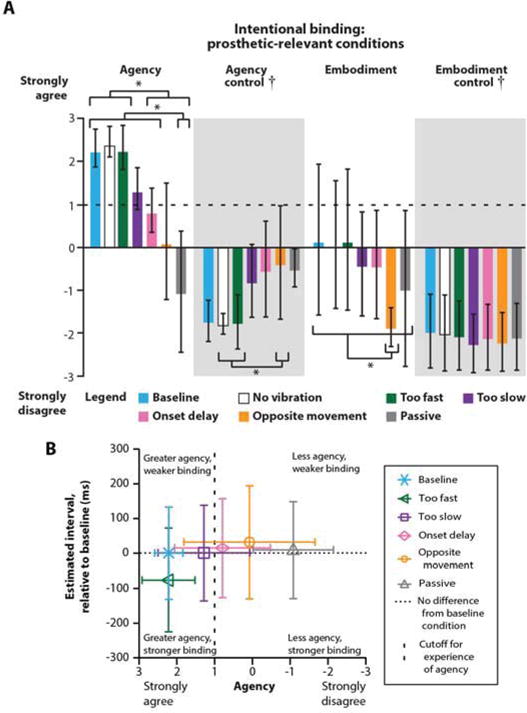
Fig. 4. Measures of agency and embodiment for combinations of intent, visual feedback, and illusory movement sensation.

(A) Average agency and embodiment questionnaire (Fig. S7D) responses across Par 1, Par 2, and Par 5 under different conditions (Baseline = illusory percept matches the hand visualization, No vibration = hand visualization closes without illusory percept, Too fast = hand visualization closes faster than the illusory percept, Too slow = hand visualization closes slower than the illusory percept, Onset delay = hand visualization closes 1 s later than the illusory percept, Opposite movement = illusory percept closes while the hand visualization opens, Passive = experimenter controlled the hand closing visualization and illusory percept; Fig. S7A,C). Error bars represent standard deviation. † indicates a significant main effect (p < 0.001) for question type (agency/embodiment vs. control) from full factorial linear mixed models (fixed effects: condition, question type). * indicates significant Bonferronicorrected post-hoc t-tests (p < 0.05) between pairs of conditions within a question type. (B) Average agency responses (n=16) compared to average estimated intervals relative to the baseline condition (n=3 intervals, 20 trials each) both averaged by condition across Par 1, Par 2, and Par 5. The horizontal dotted line denotes no difference in estimated interval from the baseline condition and the vertical dashed line indicates the +1 cutoff for an experience of agency (see: Fig. 4A). Error bars represent estimates of average standard deviation calculated as the square root of the average variance within a condition averaged across participants.
