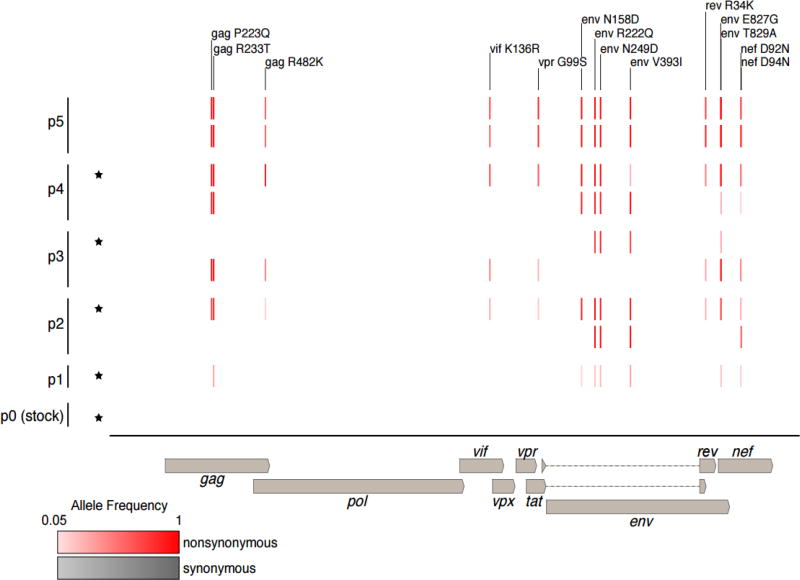
Figure 4. Viral variants that increased in frequency between generations 1 and 5.
Frequencies of nonsynonymous (red) and synonymous (grey) variants whose frequency increased by more than 0.5 between passage 1 and 5 in representative SIV populations were determined from sequencing data (see Materials and Methods). Mice used as the source of inoculum for the subsequent passage are indicated with a (*).

