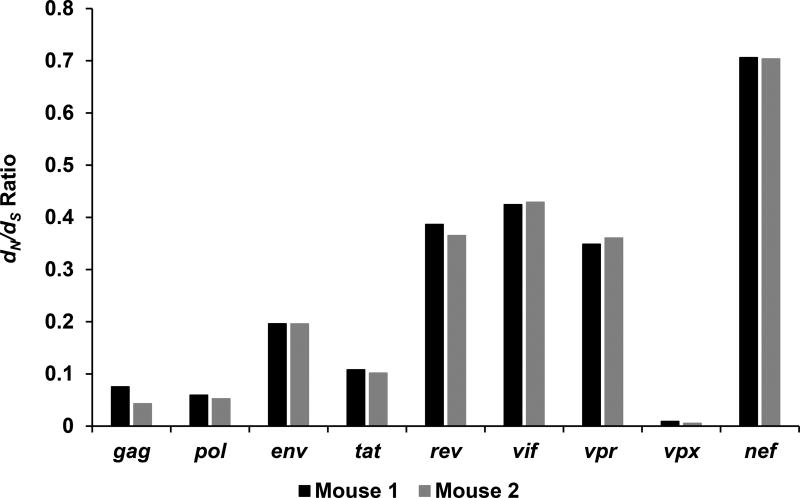
Figure 5. The dN/dS ratio of each gene from generation 5 calculated against the SIVsm reference sequence.
The dN value was calculated via SNPgenie as the mean number of nonsynonymous differences from the reference per nonsynonymous site in the input sequence with the dS value being the mean number of synonymous differences from the reference per synonymous site in the input sequence. The nef and vif genes shows the greatest dN/dS ratios in the genome, while vpx, gag, and pol all have drastically reduced ratios, suggesting that more divergent evolution is occurring in nef and vif.

